Veteran trader Peter Brandt foresees Ethereum (ETH) falling to a level last reached in early November.
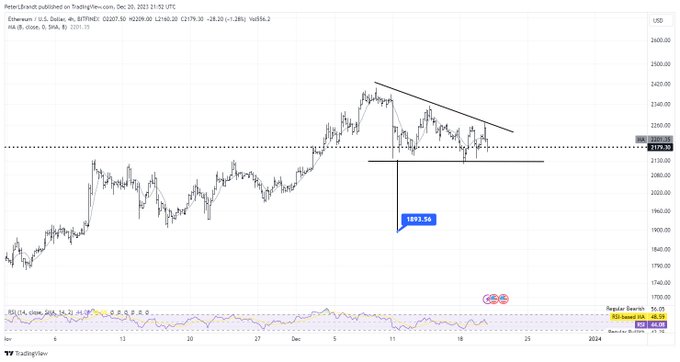
Brandt tells his 709,400 followers on the X social media platform that Ethereum is possibly forming a descending triangle, a pattern that is typically considered bearish.
According to Brandt, if Ethereum forms a “decisive close below the lower boundary” of the descending triangle, the second-largest crypto asset could plummet to at least $1,893.
Ethereum is trading at $2,267 at time of writing.
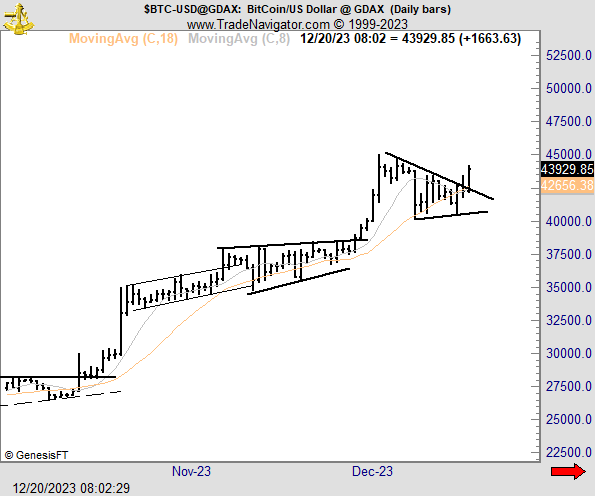
Next up is Bitcoin (BTC). The veteran trader says that the flagship crypto asset is forming a bull flag pattern on the daily chart. Bull flag patterns occur when the price of an asset is in a strong uptrend and they typically signal the continuation of the upward movement.

Bitcoin is trading at $44,101 at time of writing.
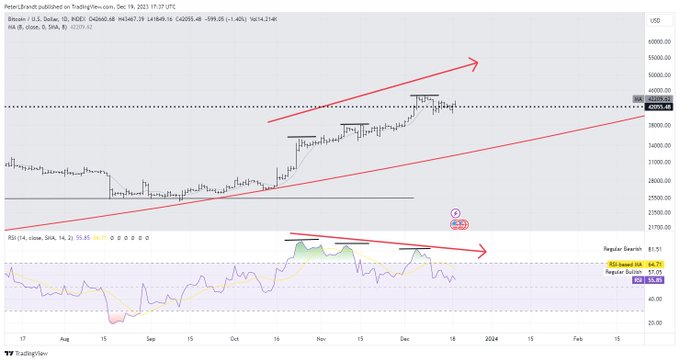
Earlier, the widely followed veteran trader had pointed out the formation of a triple divergence between the Relative Strength Indicator (RSI) and price on Bitcoin’s daily chart over the October-to-December period.
The RSI/price divergences occur when the price moves in the opposite direction of the indicator readings. Based on Brandt’s chart, it appears that the price of Bitcoin made three higher highs on the daily chart while the RSI indicator made three corresponding lower highs in the third quarter.

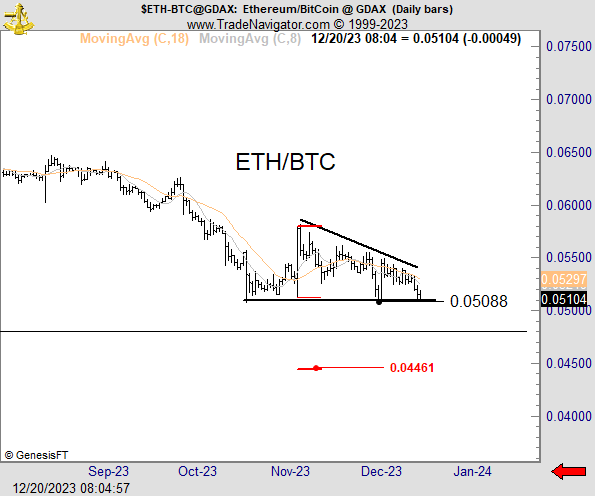
On the Ethereum/Bitcoin pair, Brandt says that the ETH/BTC pair is showing signs of a downward trend persisting amid the formation of a descending triangle on the daily chart. Descending triangles are typically considered bearish patterns.

According to Brandt, Ethereum has depreciated approximately 36% against Bitcoin year-to-date.
Don’t Miss a Beat – Subscribe to get email alerts delivered directly to your inbox
Check Price Action
Follow us on Twitter, Facebook and Telegram
Surf The Daily Hodl Mix
Click Here to Read the Full Original Article at Ethereum News – The Daily Hodl…


