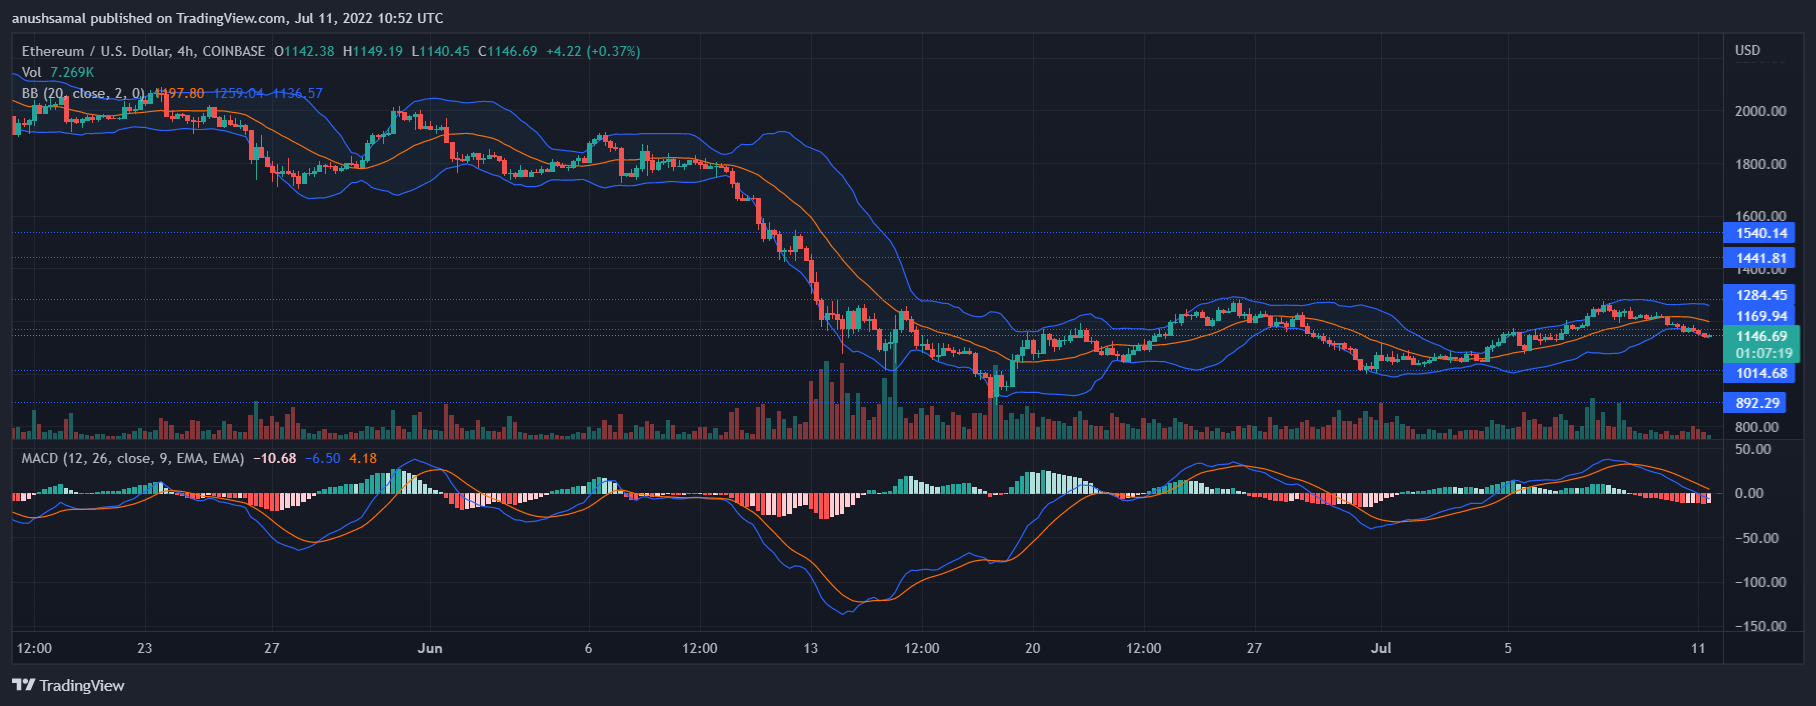
Ethereum over the past few weeks has registered multiple rejections at $1,280. It continues to aim toppling above the aforementioned price level. ETH has been trading in a downward channel since July 8.
Over the last 24 hours, Ethereum lost 3.3% which to an extent has reversed its weekly gain considerably. Technical outlook remains bearish on the short time frame. The pullback that Ethereum faced multiple times could possibly catapult price higher. In that case, ETH might target resistance levels above the $1280 mark.
The two other strong barriers for the coin stood at $1420 and $1540. Broader market strength can help Ethereum regain momentum, Bitcoin too, has been struggling at the $20,000 price level.
This has caused most altcoins to follow the same price movement. Buying strength would also start to pick up once Bitcoin displays signs of recovery on its chart. Currently, sellers continue to dominate Ethereum.
Ethereum Price Analysis: Four Hour Chart
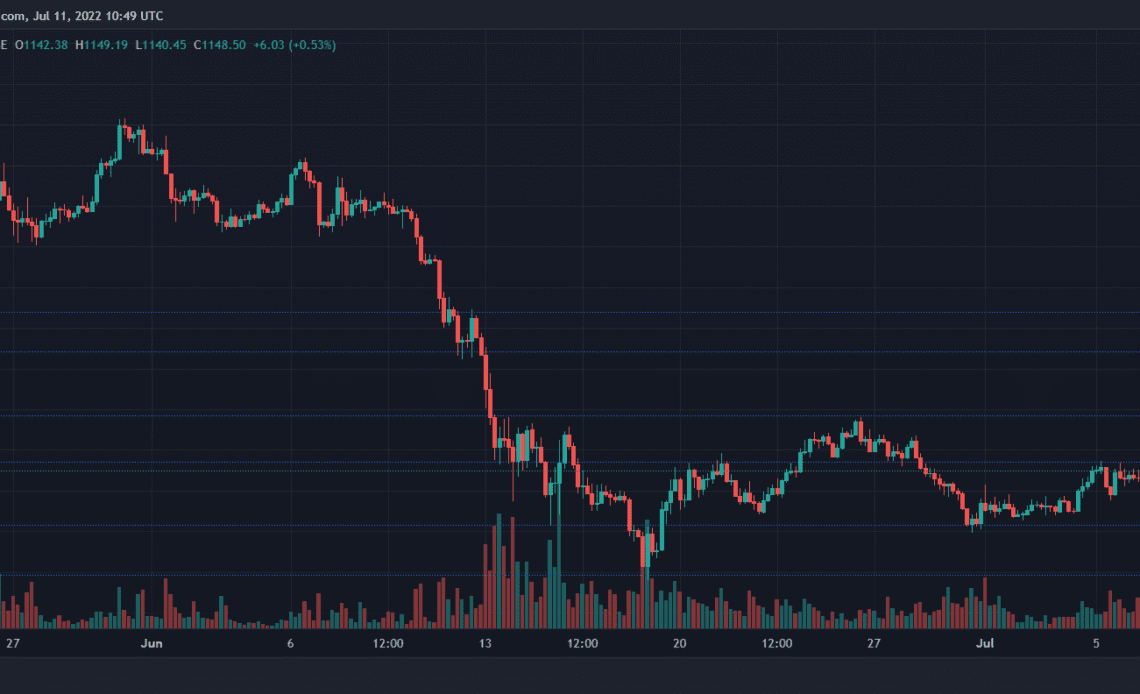
ETH was trading at $1,140 at the time of writing. It breached its support level of $1,170 and inched closer to its critical price floor of $1,000. The coin encountered a total of three price pullbacks at the $1,280 level.
Another pullback might cause ETH to push above the $1,280 level. The barriers following $1,280 stood at $1,440 and $1,540 respectively.
In case ETH fails to sustain above the $1,140 price level, it could plunge to $900. The possibility of the same cannot be ruled out given the market conditions.
Volume of Ethereum traded declined significantly signalling that buying pressure has fallen due to bearish pressure.
Technical Analysis
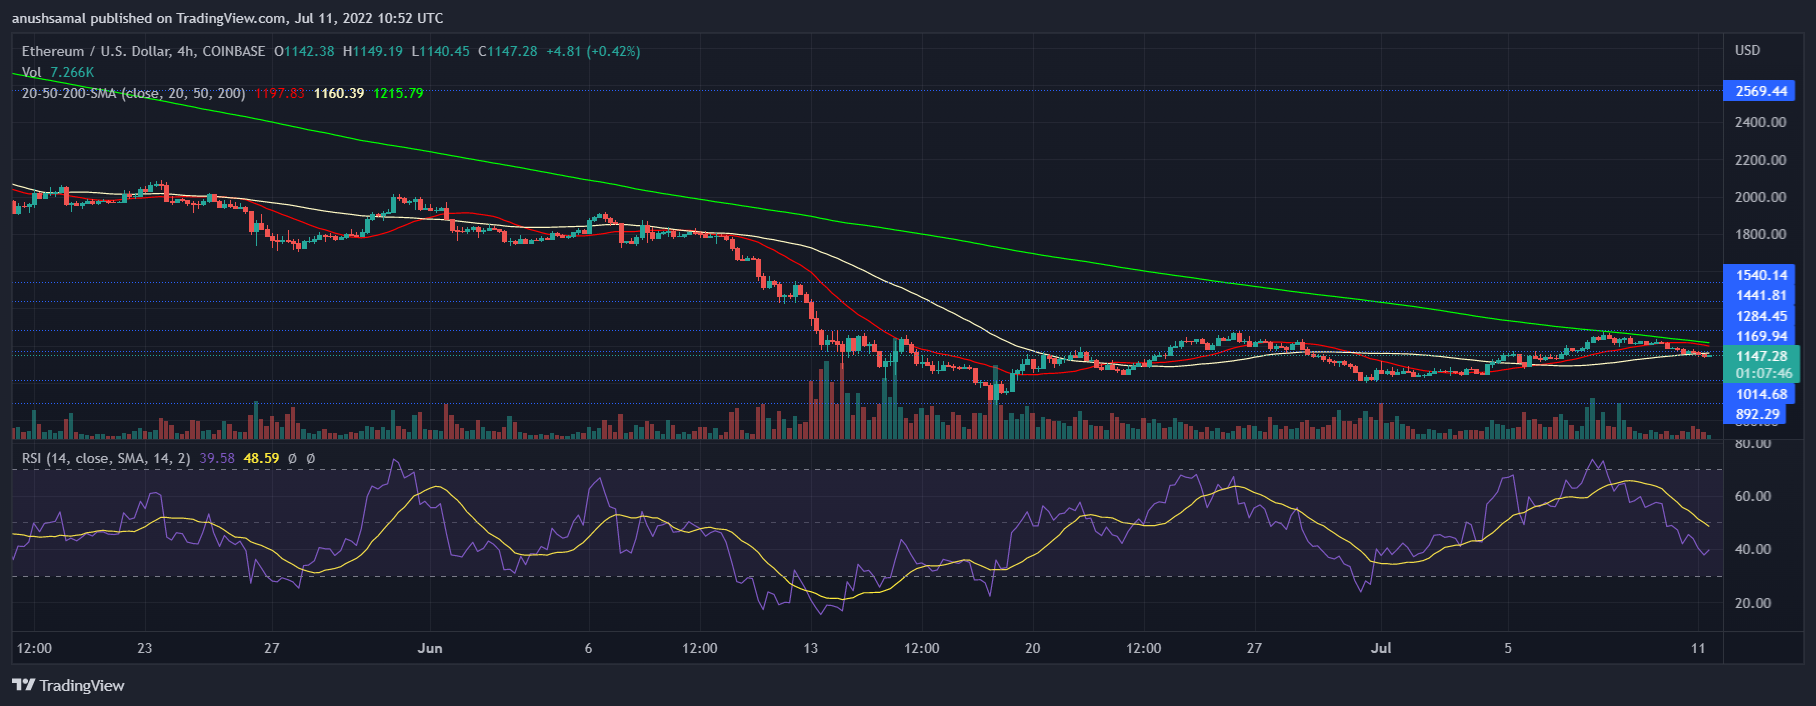
ETH registered sharp decline in buying strength over the past few days. In accordance with the same, the Relative Strength Index painted a similar picture.
RSI sloped downwards and was seen below the half-line. A reading below the half-line signifies increased selling pressure in the market.
Price of ETH was below the 20-SMA line, this indicated that the asset underwent a sell off. Sellers were responsible in driving the price momentum in the market.
Related Reading | TA: Ethereum Revisits Key Support, Can The Bulls Protect More Losses
ETH’s buying pressure has remained low and the same has been…
Click Here to Read the Full Original Article at NewsBTC…


