The price of Ethereum’s Ether (ETH) token has retreated from its recovery trend versus Bitcoin (BTC) while making a series of lower highs in April.
ETH price risks more losses vs. Bitcoin
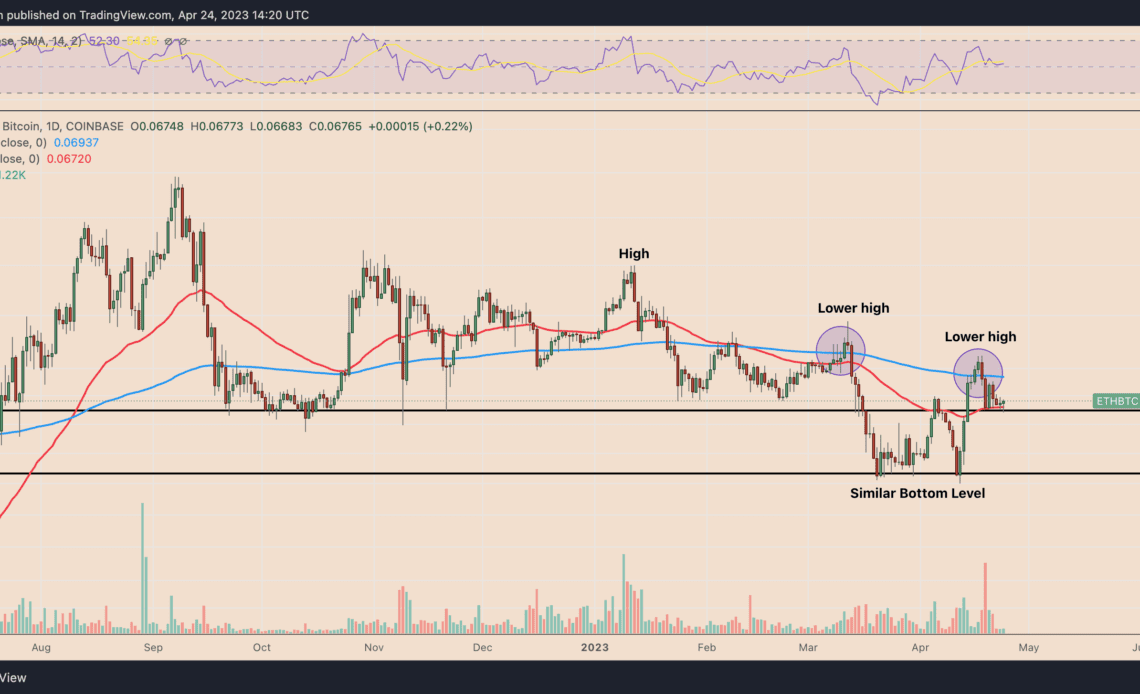
As of April 24, the ETH/BTC pair was down about 5.5% from its local high of 0.0709 BTC six days ago. The same period witnessed Ether declining nearly 15% and Bitcoin dropping 11.25% in U.S. dollar terms.
For now, ETH holds above its 50-day exponential moving average (50-day EMA; the red wave) near 0.0672 BTC. But if the March 2023 fractal is any indication, Ethereum’s price could drop sharply below the support wave.
The ETH/BTC pair saw a pullback trend in March after testing the 200-day EMA (the blue wave), breaking below its 50-day EMA in the process.
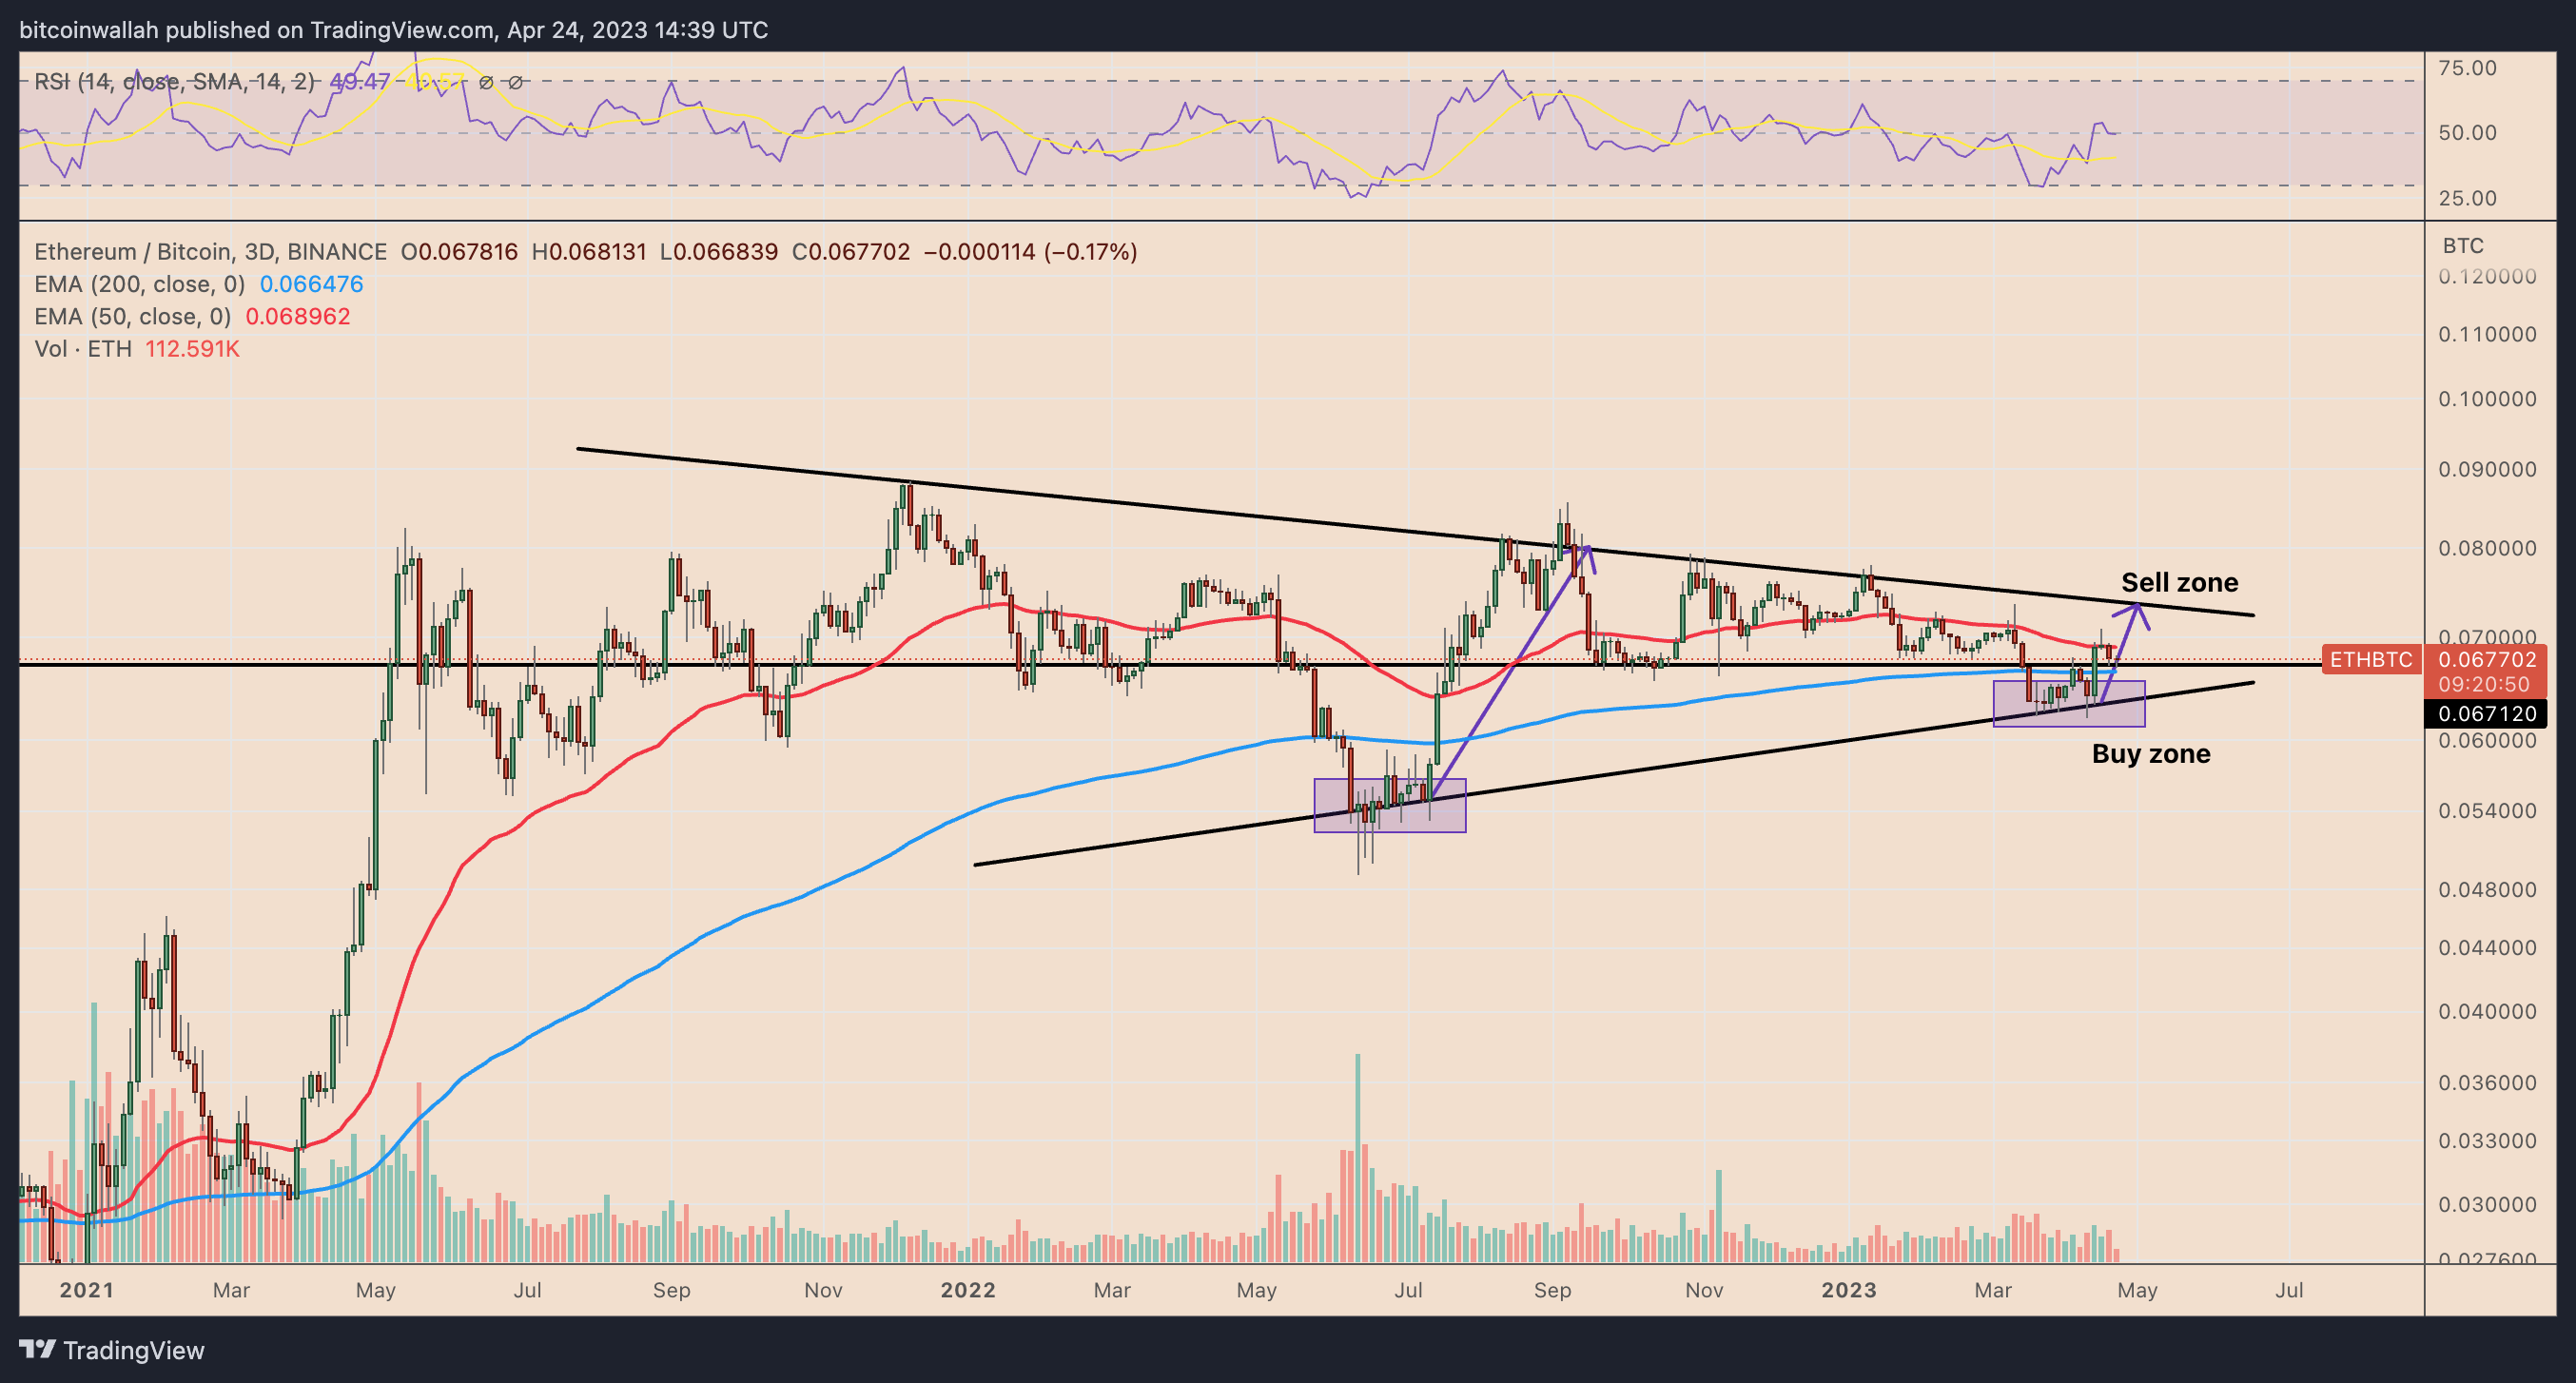
If the fractal plays out similarly in April, the downside target is 0.0627 BTC by the month’s end, about 7% lower than the current levels, and a level that served as major support in March and April.
This target also coincides with Ether’s long-term ascending trendline support — the “buy zone” in the chart below — that has been capping its bearish attempts since June 2022.

Weekly Ethereum institutional flows beat BTC
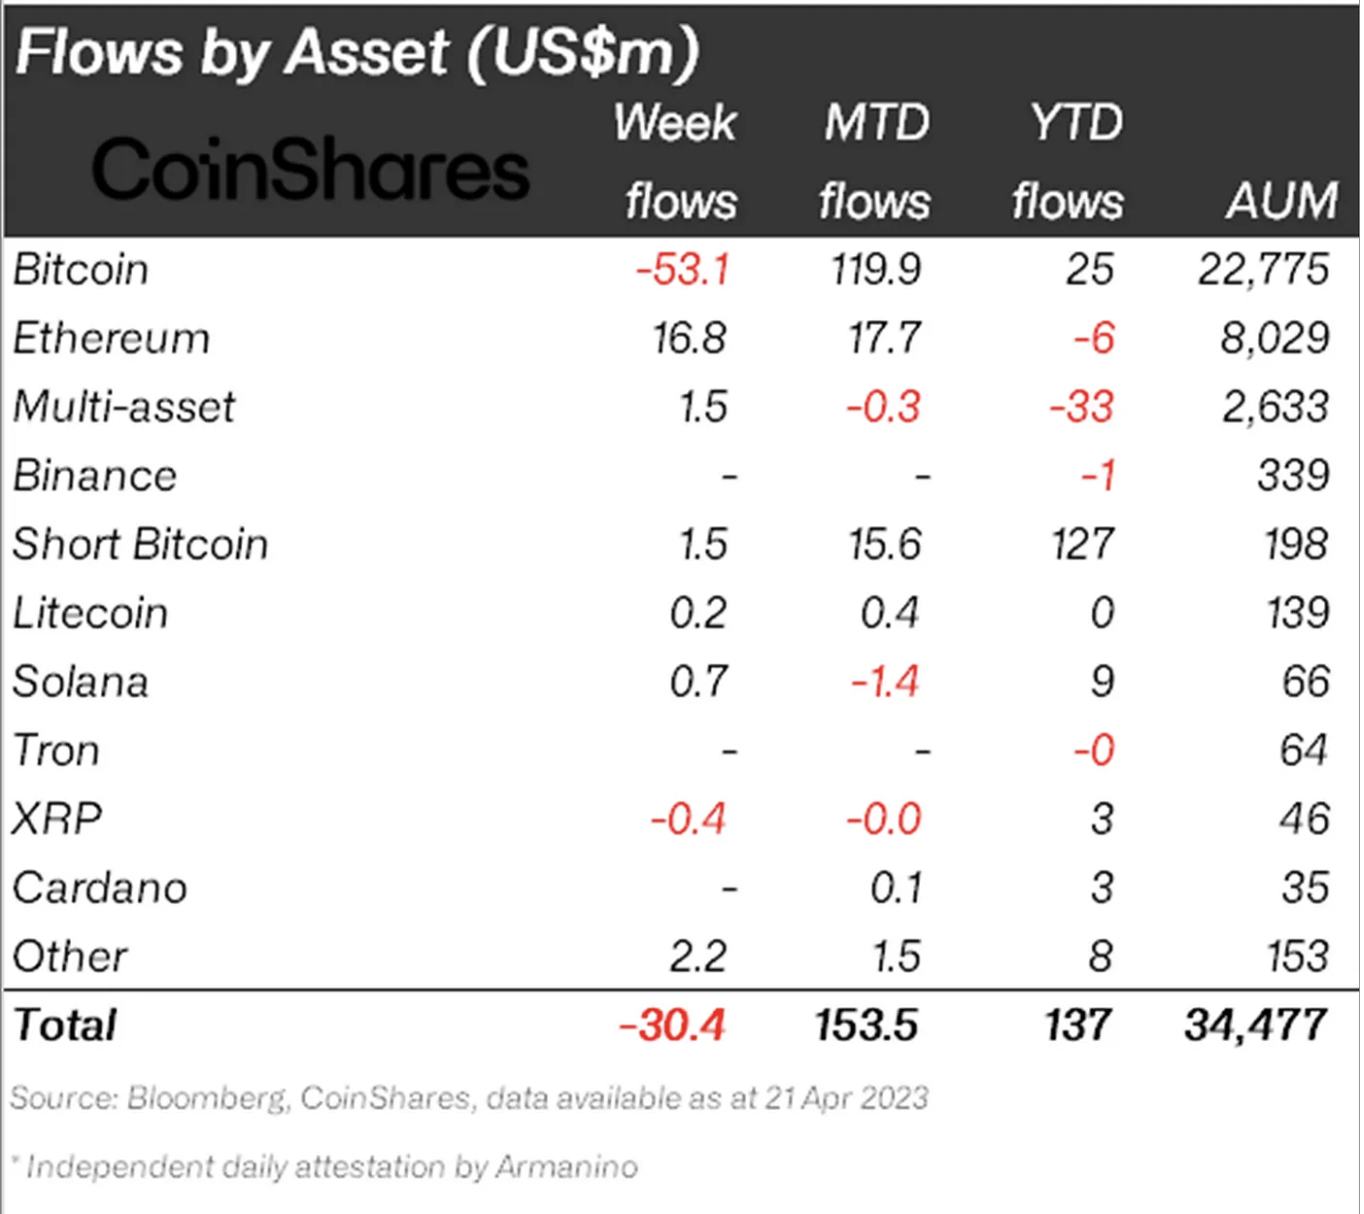
Interestingly, Ethereum’s underperformance versus Bitcoin was counter to institutional flows for the past week.
Ethereum funds attracted $17 million to their coffers in the week ending April 21 versus Bitcoin’s $53.1 million outflow, according to CoinShares’ latest report.

“These inflows suggest there is increasing confidence amongst investors following the successful implementation of the Shapella upgrade,” James Butterfill, head of research at CoinShares, noted, adding that they “were solely from Europe.”
Related: Ethereum up 20% in April while Markets Pro sees 379% gain in one day
As for Bitcoin, the outflow began around April 14 when the coin reached $30,000, a psychological…
Click Here to Read the Full Original Article at Cointelegraph.com News…


