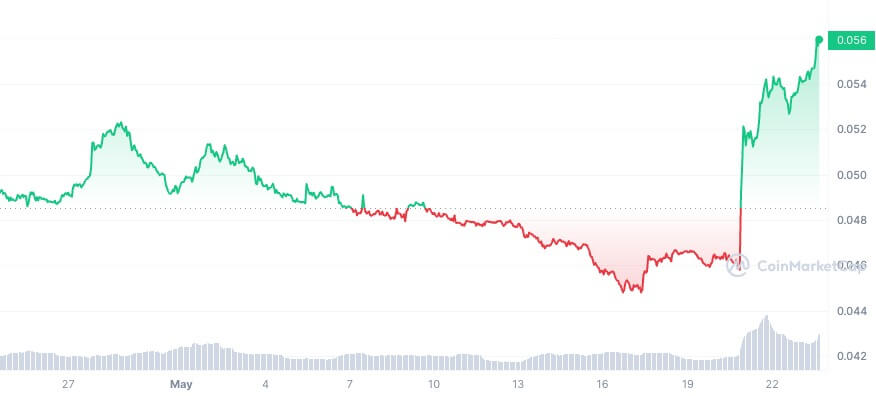
The ETH/BTC ratio represents the relative strength of Ethereum (ETH) against Bitcoin (BTC). With the two being the two largest coins by market cap and the two largest crypto ecosystems in general, it makes sense to compare their relationship to better understand the market. Tracking the ETH/BTC ratio is important as it reflects the market’s sentiment towards ETH relative to BTC. A rising ratio shows that ETH is outperforming BTC, which indicates either increased confidence in ETH or a decline in the price of BTC.
While long-term holders might not pay much attention to the ratio, active traders use it to make decisions about their trading positions to take advantage of volatility. Furthermore, the ratio provides a measure of the relative strength of ETH against BTC, which helps us understand shifts in market dominance that could lead to volatility.
This week began with a bang for ETH/BTC as the ratio saw incredible volatility. The market has been abuzz with speculation about the approval of spot Ethereum ETFs in the US. This anticipation notably impacted ETH and BTC prices, subsequently impacting the ratio.
For the better part of the past 30 days, the ratio remained relatively stable, at approximately 0.0485 around April 24. At the time, both ETH and BTC saw only moderate price fluctuations with no significant divergence that would increase the ratio.
We saw the first notable increase in the ratio around April 27, when it touched 0.0513. This correlated to a small spike in ETH’s price, rising from $3,140 to $3,250. This increase pushed the ratio up because BTC remained relatively stable at the time. This increase continued until the end of April. However, the positive momentum was broken in May as the ratio declined. It dropped to 0.0451 on May 16, when it began to recover, climbing to 0.0513 by May 20. This slow and steady increase turned into an almost vertical climb between May 20 and May 21, peaking at around 0.0560.
Click Here to Read the Full Original Article at Ethereum (ETH) News | CryptoSlate…


