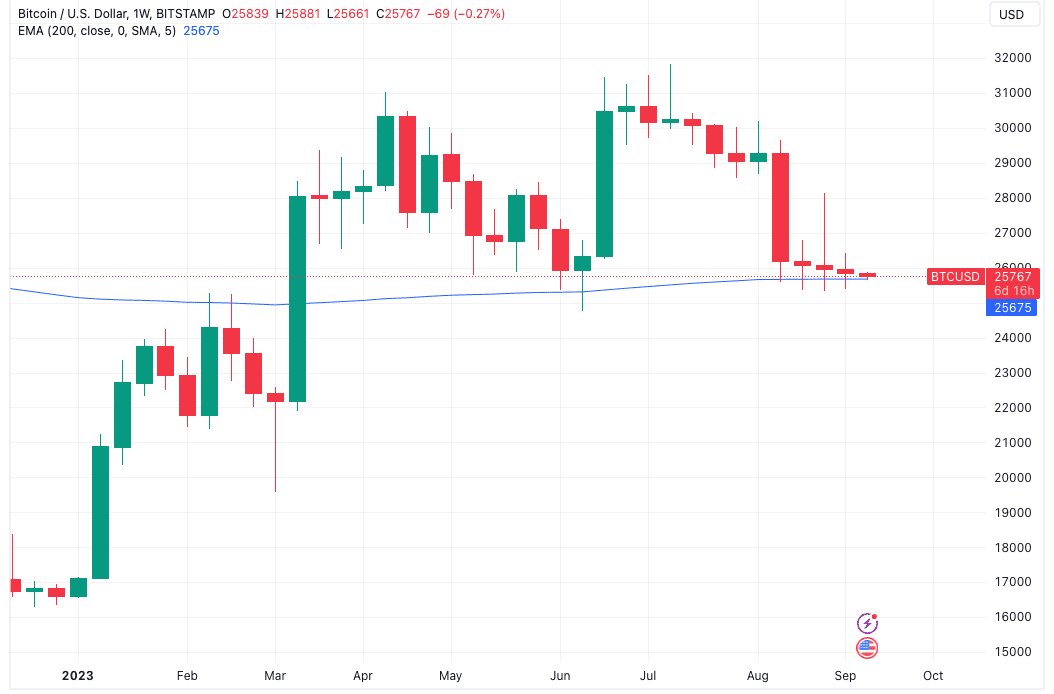
Bitcoin (BTC) begins a key macro week in a weak place as 2023 BTC action begins to look like a “double top.”
After a disappointing weekly close below $26,000, BTC/USD is struggling to catch a bid amid a return to low volatility.
Analysts, already predicting downside, continue to forecast new local lows, and liquidity conditions are increasingly supporting their argument.
Are there any silver linings on the horizon? One on-chain metric suggests that Bitcoin is “in the midst” of a major shakeout akin to March 2020.
A rebound to “fair value” may also come courtesy of Bitcoin’s relative strength index (RSI), which has almost fully retraced its year-to-date gains to reach its lowest levels since the first week of January.
Cointelegraph takes a look at these topics and more in the weekly rundown of key BTC price triggers.
Weekly close makes BTC price double top a reality
Bitcoin closing out the week below key trendlines was already expected, but the reality may be worse than many care to admit.
That is the conclusion of popular trader and analyst Rekt Capital, who warned that a close below $26,000 would “likely” validate a double top structure on the BTC weekly chart.
This currently takes the form of Bitcoin’s two 2023 local tops, both above $31,000, with a retracement to $26,000 inbetween, data from Cointelegraph Markets Pro and TradingView shows.
BTC price weakness now risks continuation downhill thanks to the latest close.
“Weekly close below ~$26,000 likely confirms the Double Top breakdown,” Rekt Capital wrote in part of an X post.
Further analysis noted that $26,000 had formed support for three weeks running, and that finally deciding its fate was thus significant on weekly timeframes.
With BTC/USD nonetheless seeing its lowest weekly close since March, popular chartist JT told X followers that there was still room for optimism. This, he argued, was in the form of the 200-week exponential moving average (EMA) near $25,600.
“This week candle was a spinning top doji, which is a candle that indicates indecision,” he wrote.
“What’s quite remarkable though is that the past three weekly closes have closed within $400 of each other! Talk about boring and flat price action! The good news is we closed well above our weekly 200EMA ($25.6K).”
Cointelegraph previously covered the significance of the 200-week EMA within the current BTC price environment.
$20,000 futures gap next?
Bitcoin slowly…
Click Here to Read the Full Original Article at Cointelegraph.com News…


