Dogecoin (DOGE) looks ready to extend its rebound move despite the current crypto bear market.
79% chances DOGE will extend its rebound move
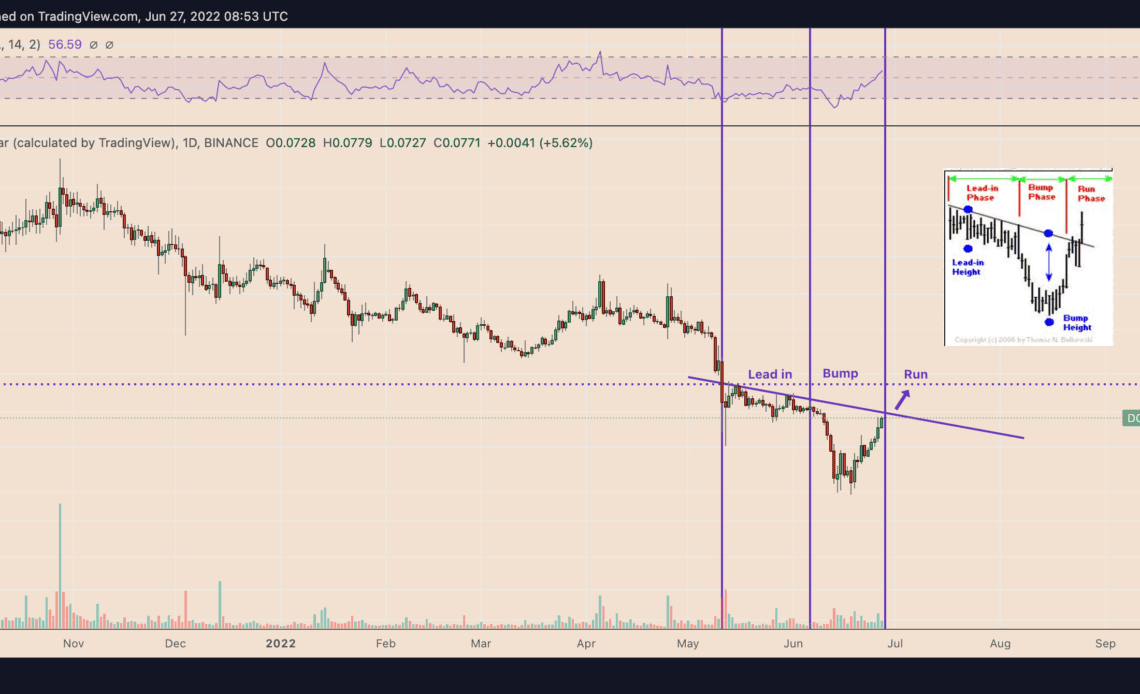
DOGE’s price appears to have been painting a “bump-and-run-reversal (BARR) bottom” since May 11, a technical pattern that points to extended trend reversals in a bear market. It consists of three successful phases: Lead-In, Bump, and Run.
The “Lead-In phase” sees the price consolidating inside a narrow, sideways range, showing an interim bias conflict among investors.
That follows the “Bump phase,” wherein the price drops and recovers sharply, leading to a price breakout, defined by the “Run phase.”
Dogecoin appears to be in the Bump Phase while eyeing a breakout above the BARR bottom’s falling trendline resistance. Suppose DOGE breaks above the said price ceiling. Then, as a rule of technical analysis, it would eye a run-up toward the BARR’s origin level.
That puts DOGE’s price en route to $0.0941, up over 20% from today’s price. Notably, the upside target also coincides with the token’s 50-week exponential moving average (50-week EMA; the blue line in the chart below).
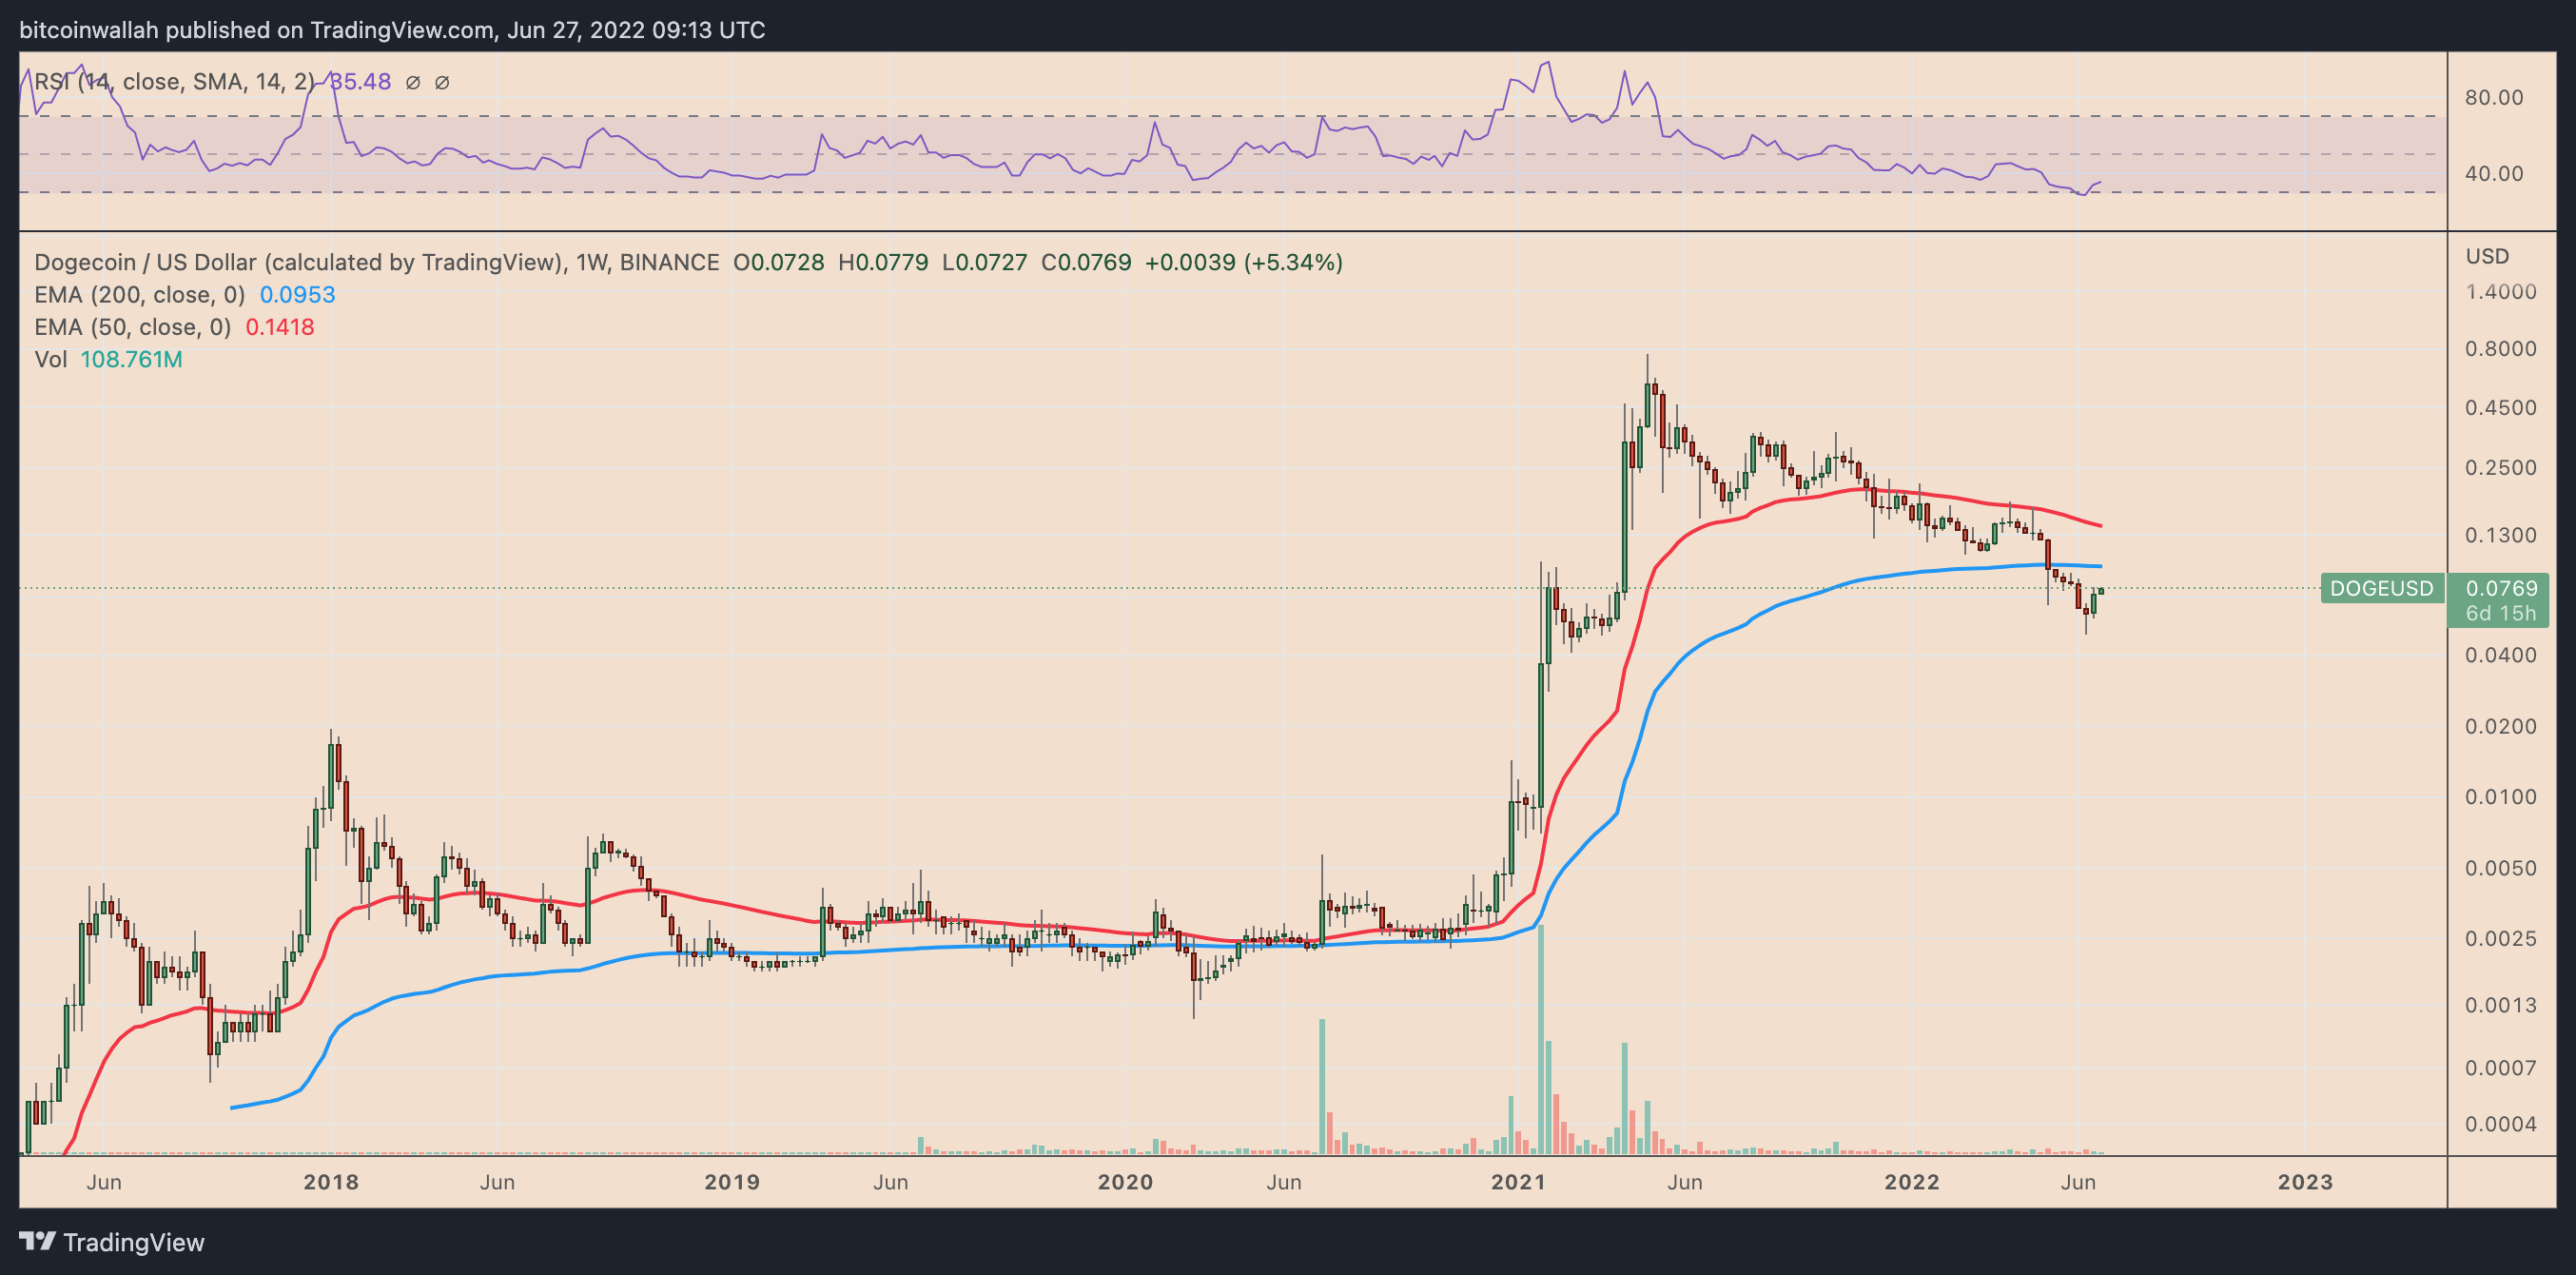
BARR bottom has met its profit target 79% of all time, according to a report by veteran investor Thomas Bulkowski. Interestingly, the pattern’s breakout stage typically yields an average 55% rise, meaning DOGE’s potential to hit $0.123 remains on the cards.
DOGE price is bottoming out?
Dogecoin’s run-up to $0.0941 might not have it escape its bearish trend owing to a flurry of technical and fundamental factors.
From the technical perspective, DOGE’s price risks run into a “bull trap” as it trends upward (it has already rallied almost 60% in the last nine days). Notably, the coin’s downside bias emerges due to a “rising wedge” pattern on its lower-timeframe charts.
In detail, DOGE has been in an uptrend inside a range defined by two ascending, contracting trendlines, thus making a rising wedge.
As a rule, this technical setup leads to a bearish reversal, confirmed when the price breaks below the wedge’s trendline.
As it does, the price could fall by as much as the maximum distance between the wedge’s upper and lower trendline.
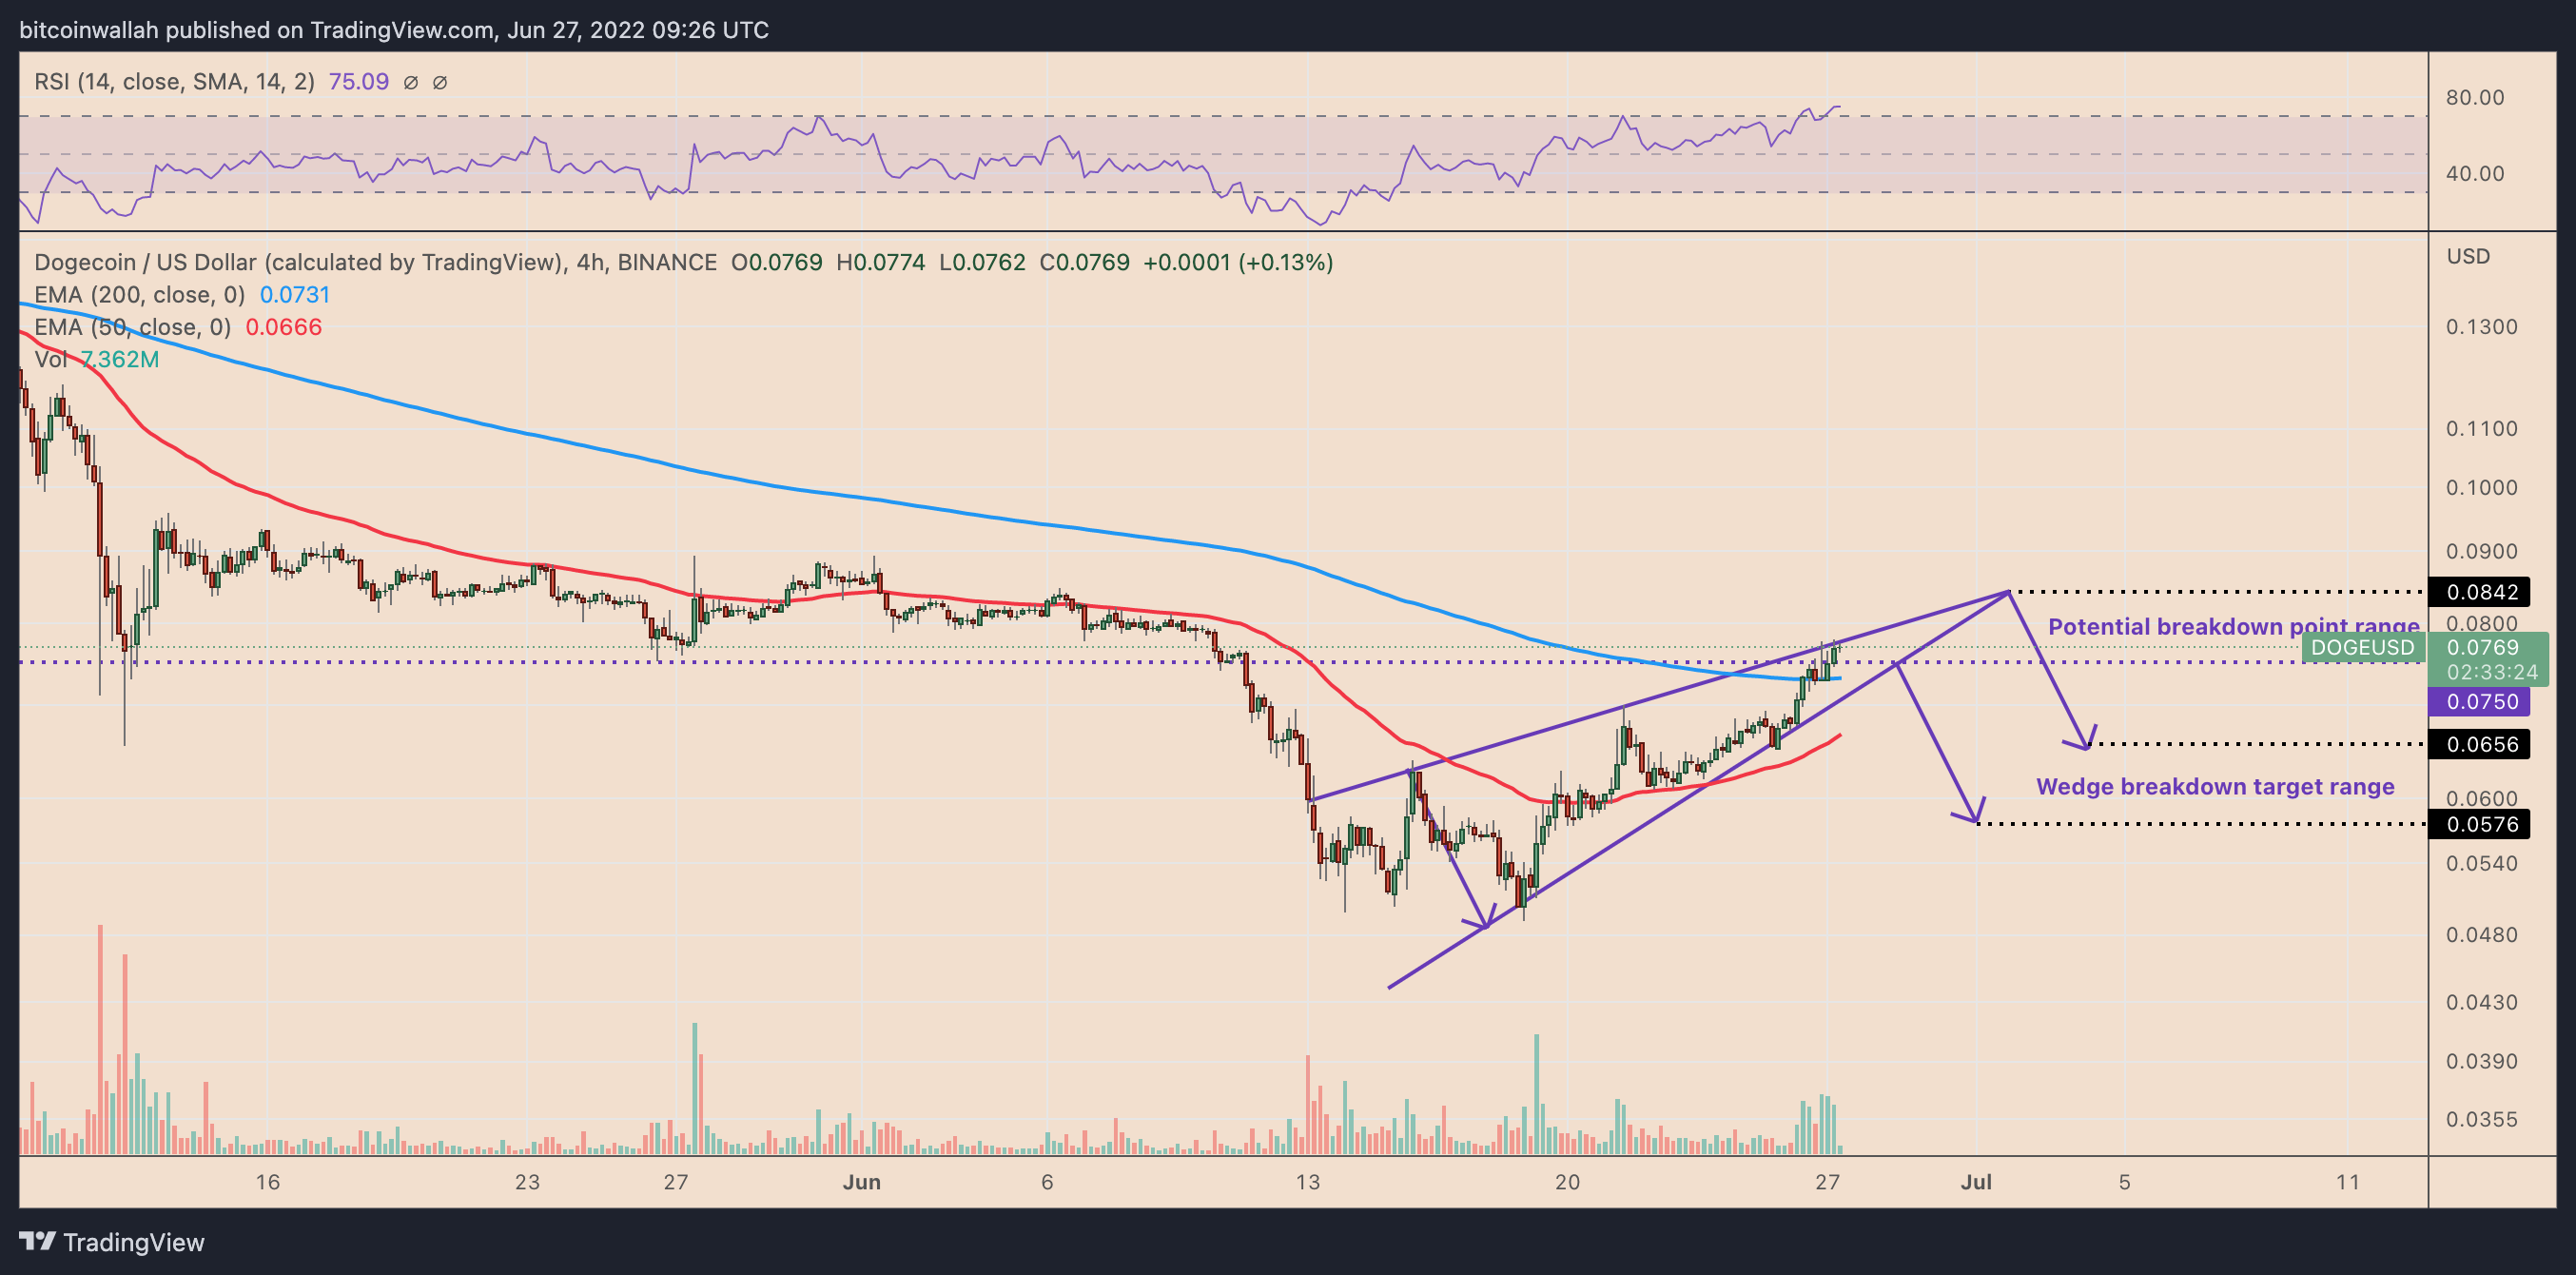
DOGE’s rising wedge’s potential breakout points fall within the $0.07-$0.08 range. So, the token could…
Click Here to Read the Full Original Article at Cointelegraph.com News…


