
Bitcoin (BTC) has been stuck in a narrow range for the past several days. A minor positive is that the range has formed near the recent local high. This suggests that the bulls are not rushing to the exit as they anticipate another leg higher.
Bitcoin’s consolidation has pulled its market dominance to 48% from over 50% on June 30. This shows that market participants have been gradually shifting their focus to select altcoins, which are starting to move up.
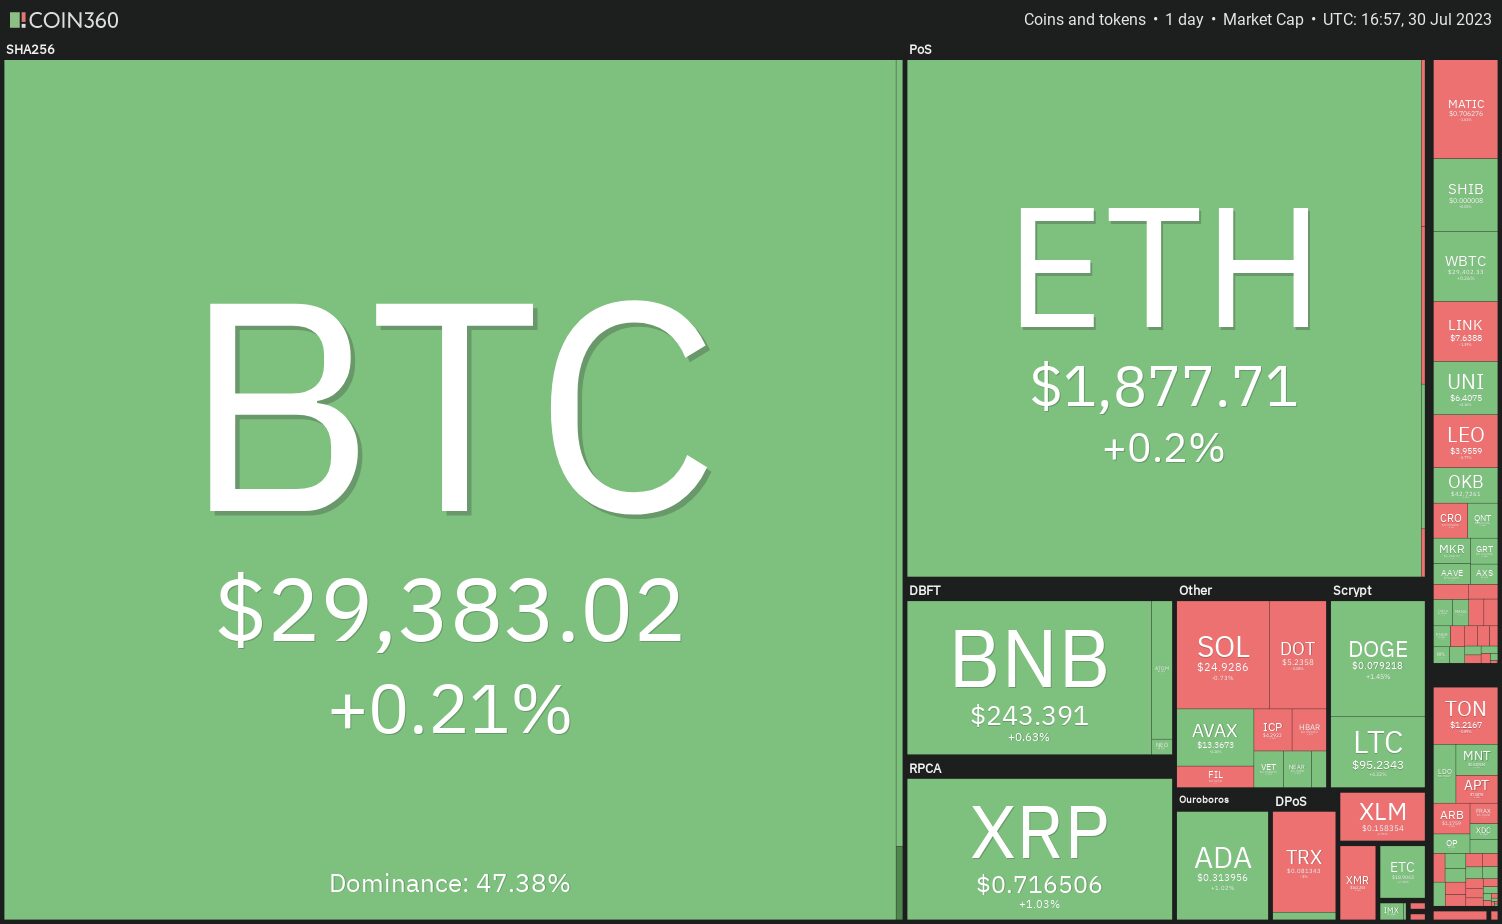
However, an altcoin recovery is likely to remain in place only till Bitcoin shows strength. If Bitcoin turns down sharply, the possibility of a sell-off in altcoins remains high. While select altcoins provide trading opportunities, cryptocurrency traders should be careful and keep a close watch on Bitcoin’s price action.
What are the important support and resistance levels to watch out for on Bitcoin? Let’s study the charts of top-5 cryptocurrencies that may try to move in the near term.
Bitcoin price analysis
The bulls managed to sustain Bitcoin above the 50-day simple moving average ($29,377) for the past few days but a negative sign is that they haven’t been able to propel the price above the 20-day exponential moving average ($29,670).
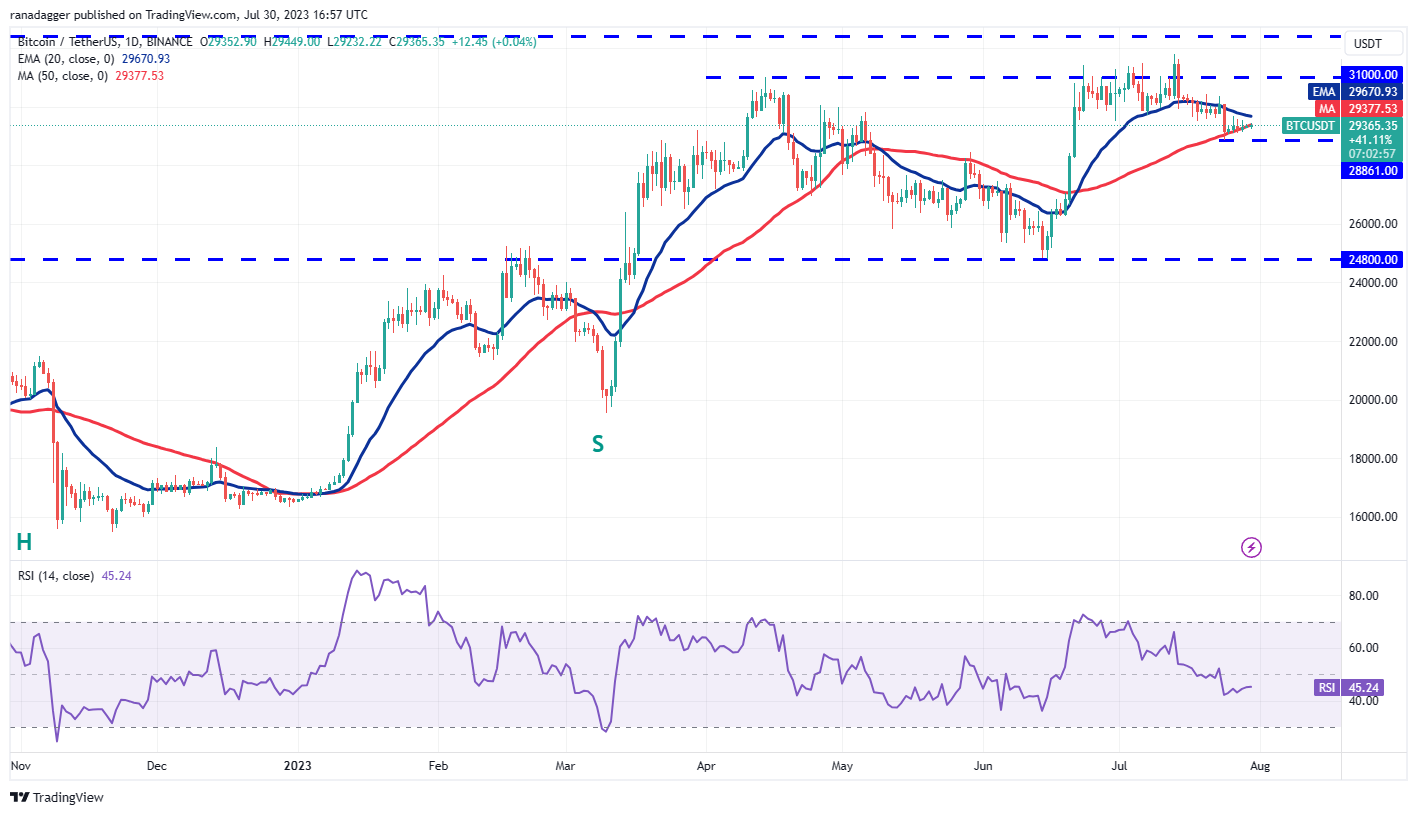
The bears will try to strengthen their position by pulling the price below the immediate support at $28,861. If they manage to do that, it will suggest that the BTC/USDT pair could stay range-bound between $31,000 and $24,800 for some time. The gradually downsloping 20-day EMA and the relative strength index (RSI) in the negative territory indicate advantage to bears.
This bearish view will invalidate if the bulls drive the price above the 20-day EMA. The pair could then rise to the overhead resistance zone between $31,000 and $32,400. The bulls will have to overcome this barrier to signal the start of a new uptrend to $40,000.
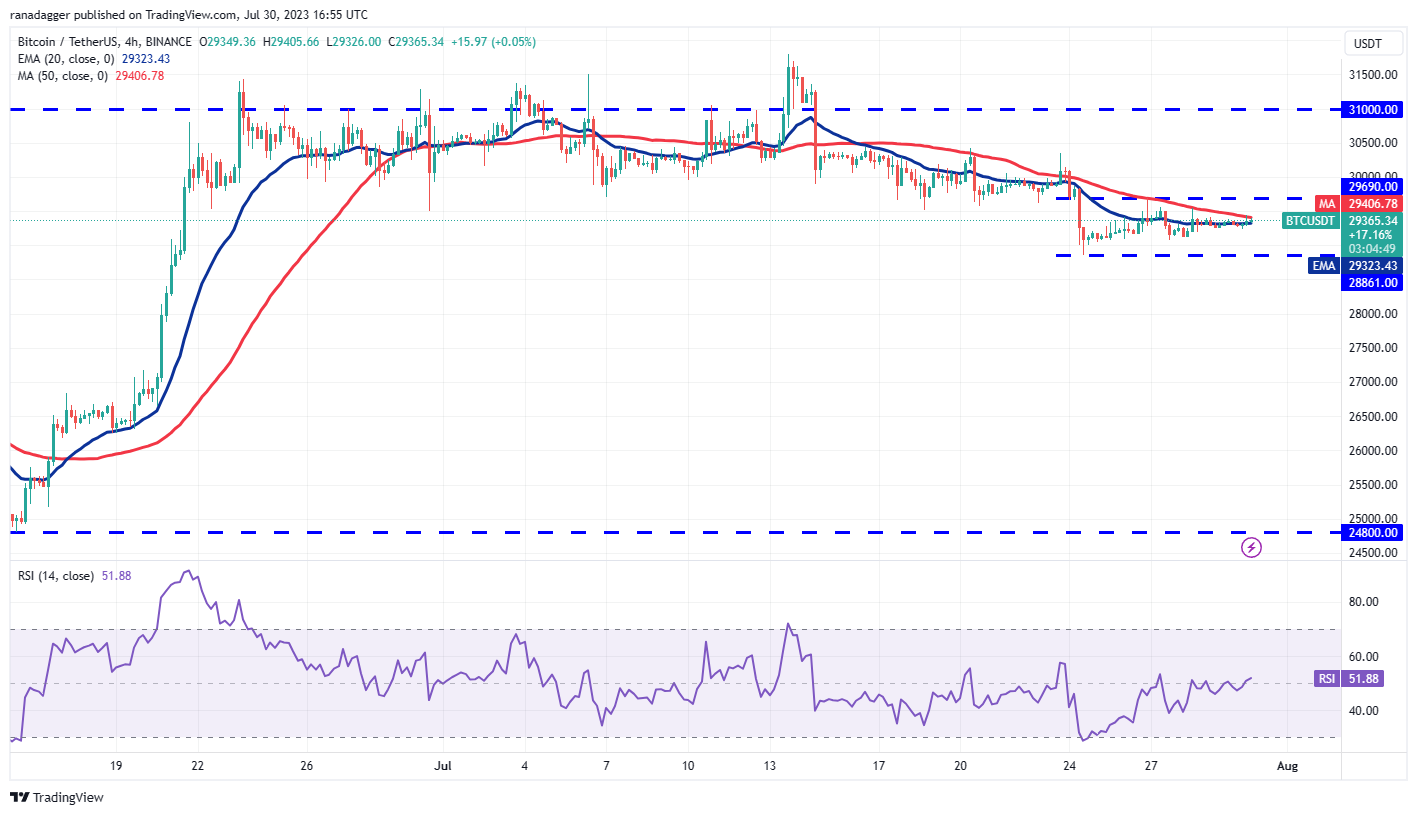
The 20-EMA has flattened out and the RSI is near the midpoint, indicating a balance between supply and demand. The pair is stuck inside a narrow range between $28,861 and $29,690.
A break and close above the overhead resistance will indicate that the advantage has tilted in favor of the bulls. The pair could then rise to $30,500 and later to $31,500.
Alternatively, if the price turns down and breaks below $28,861, it will suggest that bears are in control. The pair could then slump to $27,500.
Dogecoin price…
Click Here to Read the Full Original Article at Cointelegraph.com News…


