The founder of on-chain analytics firm CryptoQuant has said Bitcoin could reach a target of $112,000 this year driven by the ETF inflows.
Bitcoin May Hit $112,000 Based On Inflows Into The ETFs
In a new post on X, CryptoQuant CEO and founder Ki Young Ju talked about the outlook of the cryptocurrency based on the inflows going towards the spot exchange-traded funds (ETFs).
The analyst has used the “Realized Cap” indicator to find price targets for the coin. The Realized Cap refers to a capitalization model for Bitcoin that calculates the total valuation of the asset by assuming that the real value of any coin in circulation is the price at which it was last transacted on the blockchain.
If the previous transaction of any token is assumed to have involved a change of hands for it (that is, buying and selling took place), then the last transfer price would correspond to the cost basis of the coin.
As the Realized Cap essentially adds up the cost basis of all the investors, one way to look at the metric is as a measure of the total amount of investment the holders have put into the coin.
Naturally, the Realized Cap pushes up as trades occur at a higher spot price. Something that could be particularly influential for the Realized Cap this cycle may be the spot ETF inflows.
The spot ETFs, which finally got approval from the US Securities and Exchange Commission (SEC) last month, have been buying up Bitcoin at relatively high prices to add to their holdings, thus elevating the Realized Cap.
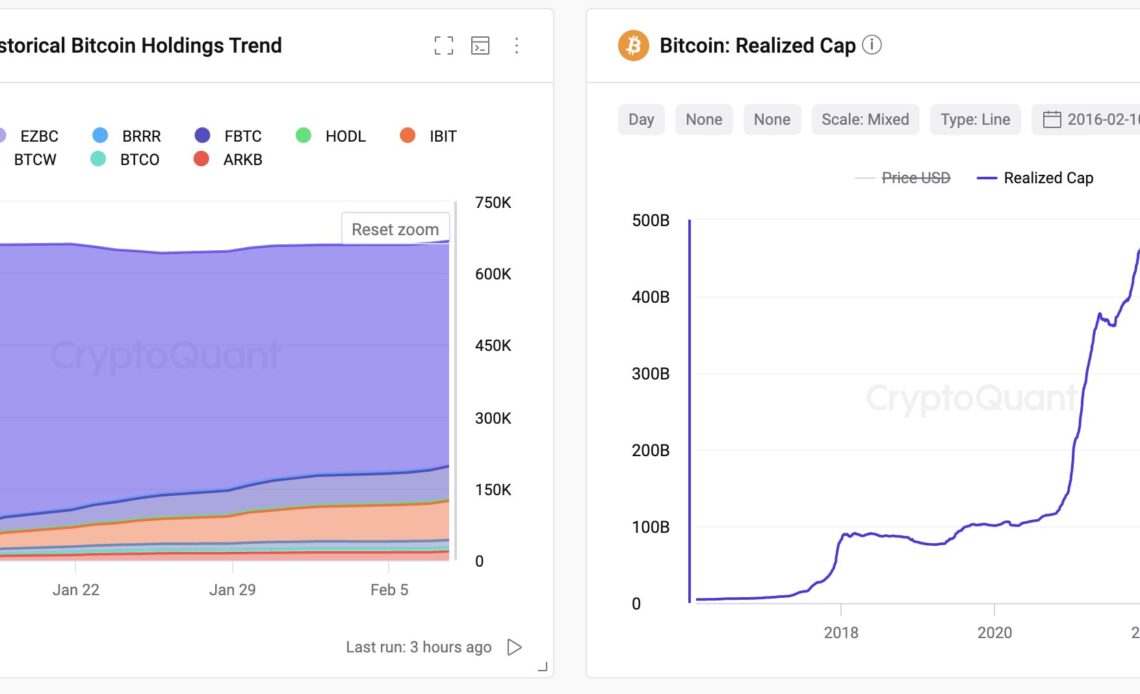
The chart below shows the data for the holdings of the spot ETFs and the Bitcoin Realized Cap.
The trend in the spot ETF holdings and BTC Realized Cap | Source: @ki_young_ju on X
“Bitcoin market has seen $9.5B in spot ETF inflows per month, potentially boosting the realized cap by $114B yearly,” explains Ju. “Even with $GBTC outflows, a $76B rise could elevate the realized cap from $451B to $527-565B.”
The Market Value to Realized Value (MVRV) ratio may provide some hints regarding how the Realized Cap could be relevant for the spot price. This indicator tracks the BTC Market Cap and the Realized Cap ratio.
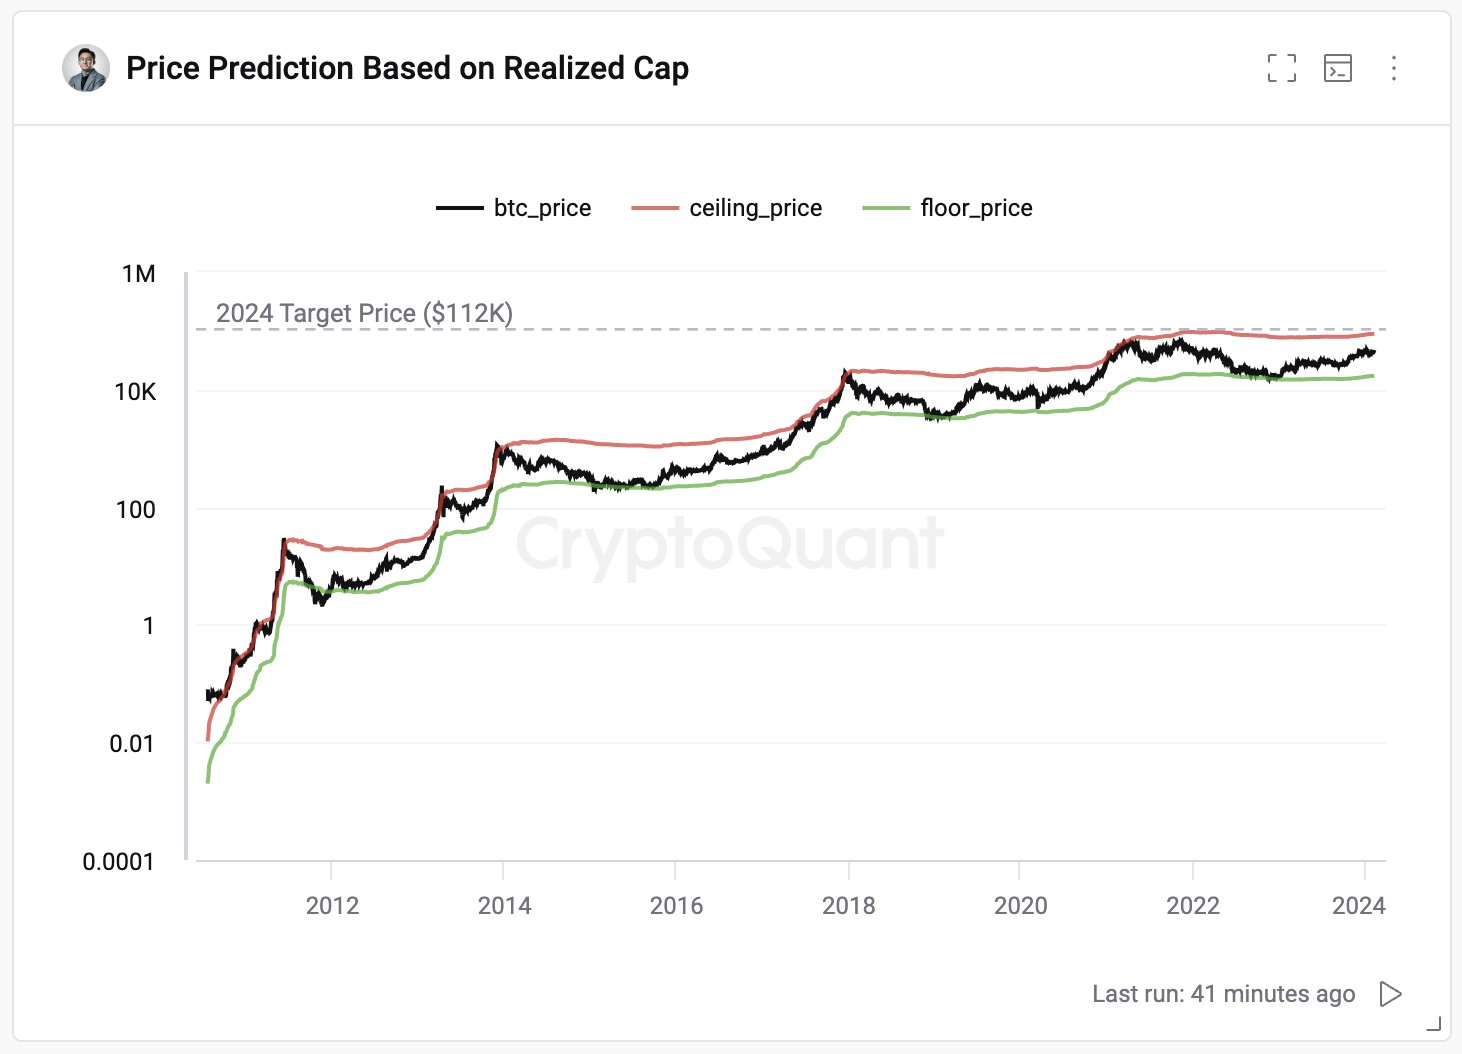
“Historically, BTC market bottoms occur at an MVRV of 0.75 and tops at 3.9,” notes the CryptoQuant founder. Based on this fact, the table below shows that ceiling and floor prices can be defined for the asset.

The trend in the ceiling and floor prices for BTC based on the Realized Cap | Source: @ki_young_ju on X
As the…
Click Here to Read the Full Original Article at NewsBTC…


