According to the analysts on the Discover Crypto YouTube channel (with 1.4 million subscribers), Cardano might surge to $5. This prediction starkly contrasts with the pessimistic views currently circulating within the broader cryptocurrency community, challenging recent headlines that have questioned ADA’s future viability.
Why Cardano Could Hit $5
The analyst first addressed the negative sentiment surrounding Cardano, pointing out a series of bearish headlines from various crypto news outlets. He highlighted the contradiction between the public perception of Cardano as a “dead coin”t and the ongoing vigorous development activities within the Cardano ecosystem.
“Despite what the mainstream media is portraying, the development activity on Cardano has been robust, ranking third among all cryptocurrencies,” the analyst asserted. This was further emphasized by recent data showing that developers continue to build and refine the platform, indicating a healthy and active development environment.
Related Reading
Focusing on the forthcoming Chang hard fork, the analyst described this event as a pivotal moment for Cardano. “The Chang hard fork represents the most significant milestone in Cardano’s history,” he noted. He added, “Maybe articles are out there trying to suppress the price right before the price goes parabolic and just rallies to the upside potentially even $5 this cycle.”
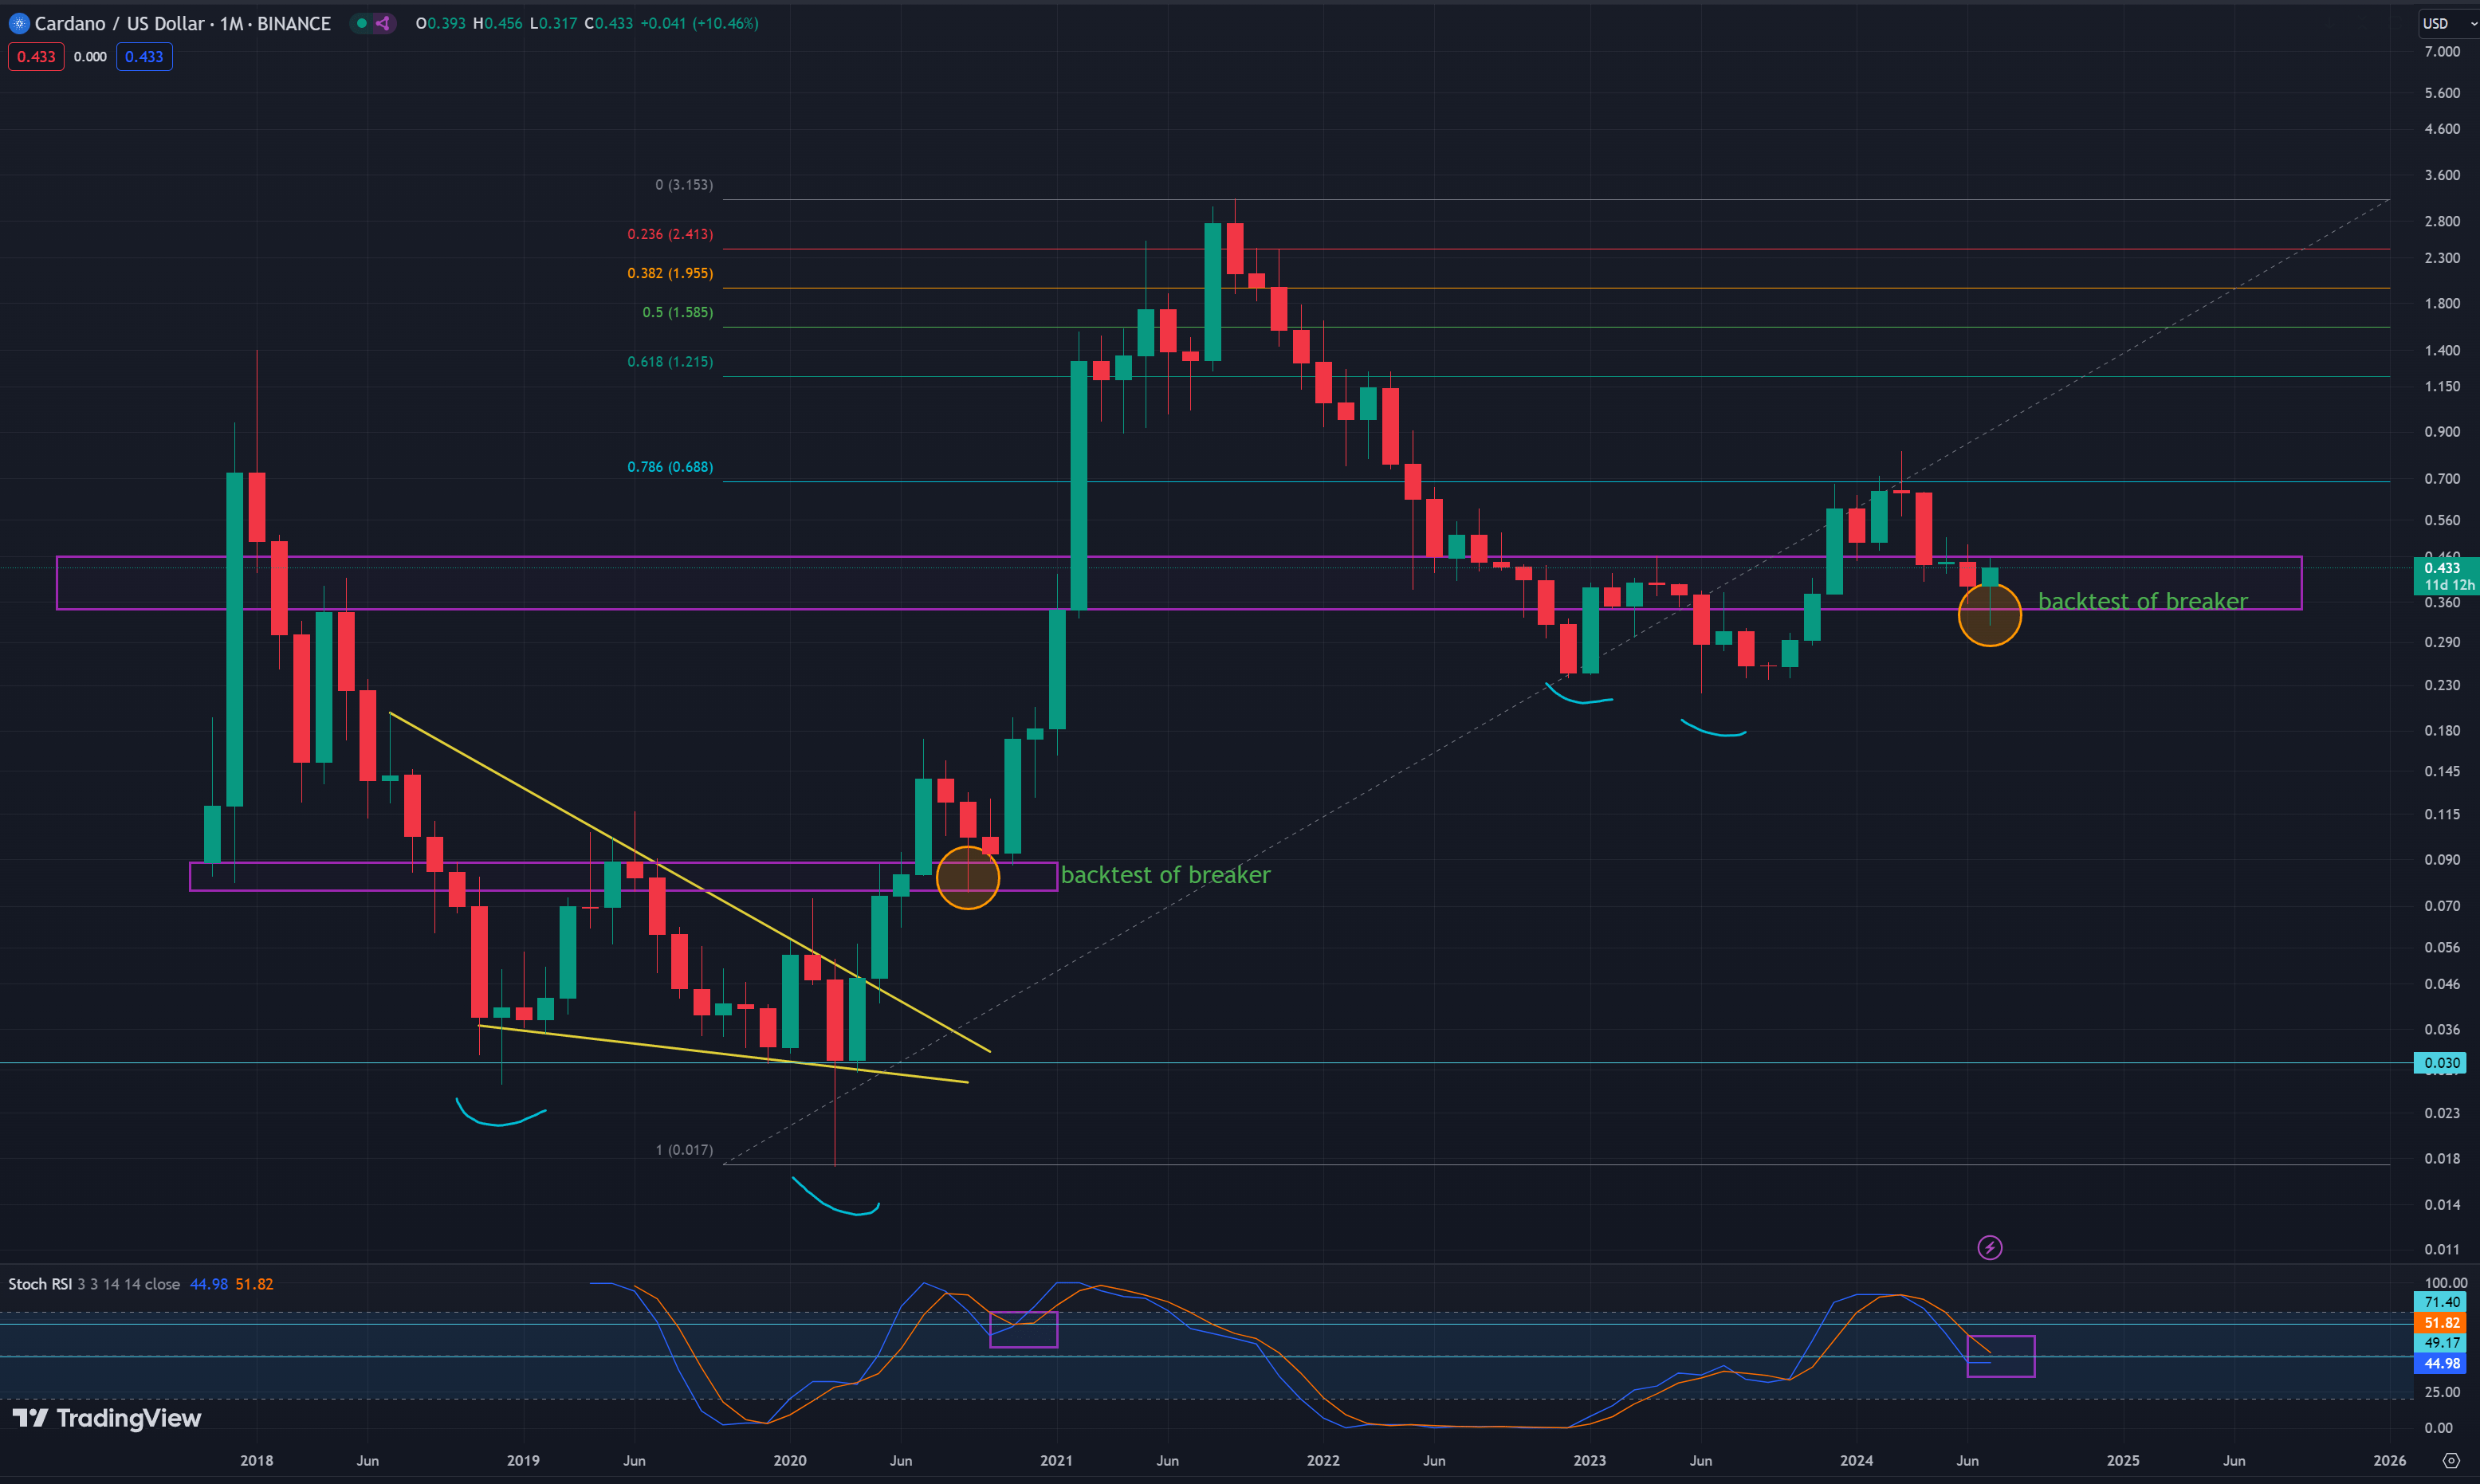
From a technical analysis standpoint, the analyst introduced the “breaker block pattern,” a less common but noteworthy technical chart pattern often used by traders. The breaker block pattern occurs when a corrective price block is fully retraced after a strong directional market move.
This pattern is considered bullish as it typically indicates that after a period of price consolidation or correction, the original bullish trend has regained strength and is likely to continue. “We’re observing a classic breaker block formation in ADA’s chart, which historically precedes significant price rallies,” explained the analyst.
Related Reading
Coupled with this pattern, the analyst pointed to a promising stochastic RSI crossover on the monthly chart—a technical indicator often used to predict changes in momentum. “The stochastic RSI is about to cross, and this is a very bullish sign historically. When this blue line passes the orange line, it sets up…
Click Here to Read the Full Original Article at NewsBTC…


