In a technical analysis, renowned crypto analyst Gert van Lagen presented an extremely bearish outlook for Solana (SOL), suggesting that its price is poised for a substantial downside move. Van Lagen’s analysis is underpinned by the widely acclaimed Elliott Wave Theory, a methodology that seeks to identify recurring patterns and cycles in market price movements.
Why The Solana Price Could Crash
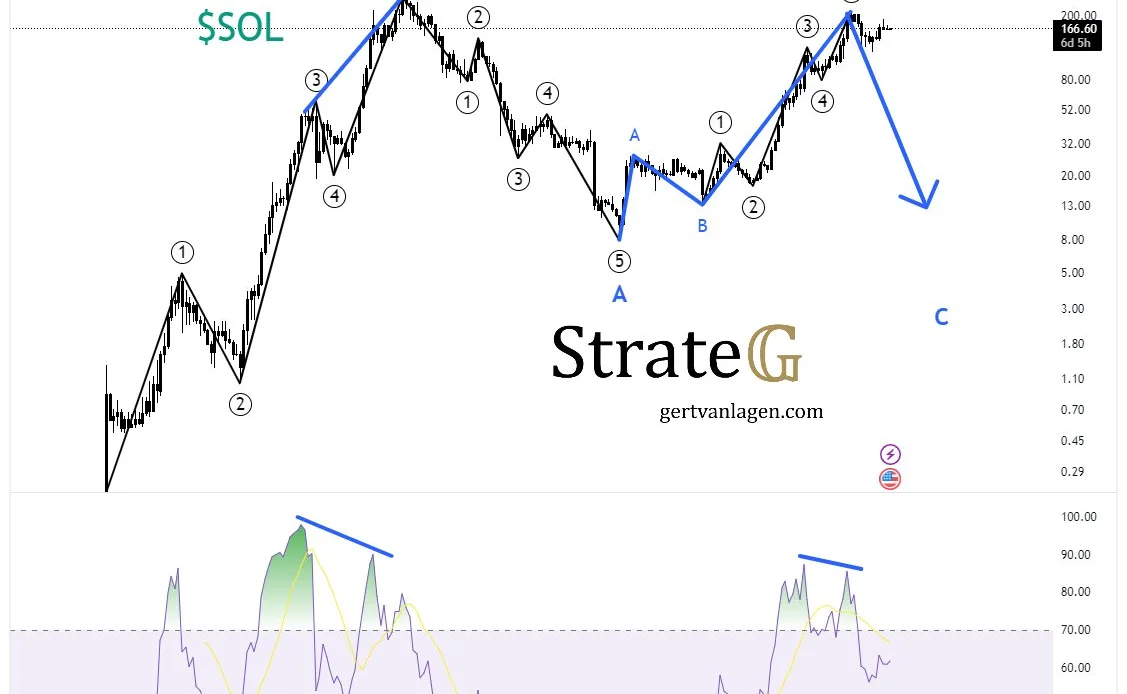
At the core of Van Lagen’s analysis lies a dissection of Solana’s price action over the past few years. According to his assessment, the year 2021 marked the culmination of a clean Elliott Wave trend for Solana, signaling the end of a bullish cycle. This uptrend is characterized by a specific pattern of five waves, with the final wave acting as the climactic move before a reversal.
Moving into 2022, Van Lagen’s analysis identifies the unfolding of the A-wave down, which he classifies as the first leg of a prolonged bear market. Crucially, this A-wave down exhibits a distinct pattern of five subwaves, aligning with the principles of the Elliott Wave Theory. The presence of these subwaves is a key indicator that the downtrend is likely to persist, as they are believed to reflect the underlying market sentiment and psychology.
Related Reading
In 2023, Van Lagen observed the formation of the B-wave, a corrective rally within the broader bear market context. Just like the A-wave, this B-wave is composed of five subwaves, adhering to the Elliott Wave Pattern for corrective movements. The identification of this B-wave is crucial, as it suggests that the overall downtrend has not yet been fully exhausted and that further downside momentum may be forthcoming.
As the analysis shifts to 2024, Van Lagen’s expectation is for the C-wave to materialize. In the Elliott Wave Framework, the C-wave is the final leg of the broader bear market cycle, and its occurrence would potentially mark the completion of the ongoing downtrend for Solana.
Notably, Van Lagen’s analysis also highlights the presence of bearish divergence on the weekly Relative Strength Index (RSI), a widely used momentum oscillator. Bearish divergence occurs when the price makes higher highs while the RSI fails to confirm these highs, potentially signaling a forthcoming trend reversal or a loss of bullish momentum.
Related Reading
Van Lagen posted via X: “I’m short on SOL –> ready for the next leg…
Click Here to Read the Full Original Article at NewsBTC…


