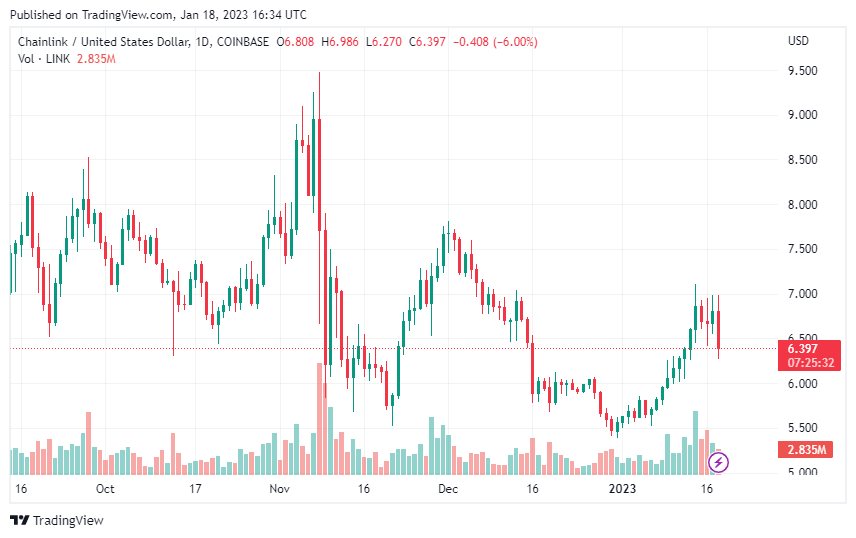
The global cryptocurrency market cap is currently down by 1.61%, but LINK holds its gains on the weekly chart. With institutional investors and whales engaged in trading activities, the crypto market is experiencing a revival.
Chainlink has enjoyed a resurgence this week with an increase in its price and trading volume. The network has also recorded a massive increase in trading volume today at 30.64%. The coin is now ranked number 21 on the list of cryptocurrencies.
What Is Behind The Rally?
The Chainlink network has added some notable projects to its catalog. The total value of transactions, its oracle service, exceeded $6.9 trillion. Also, the network provided users with data feeds that extend across new blockchains and layer 2.
Another innovation driving the price is the Chainlink proof of reserve. The collapse of FTX created distrust in the industry. This distrust prompted the increased demand for Proof of Reserves. Chainlink’s Proof of Reserve has become popular among stablecoins and wrapped tokens to provide their customers with transparency. The adoption has also aided the LINK price increase.
Also, the launch of Web3 solution Chainlink Economics 2.0 has created a framework for the network’s core interests; Chainlink BUILD, SCALE, and Staking. Chainlink’s BUILD and SCALE enable users to build Web3 dApps. Sergey Nazarov, Chainlink’s co-founder, stated that the crisis in traditional finance creates opportunities for blockchain technology to fortify crypto as an alternative financial system.
Chainlink Price Prediction
Chainlink LINK has enjoyed a positive rally in the past week. The asset is currently trading at $6.50 as it approaches the $7 mark. The support levels are $6.27, $6.44, and $6.64, while the resistance levels are $7.01, $7.18, and $7.37. LINK is close to its first resistance level, but the uptrend might pull back as the bearish candles begin to form on the chart.
The asset is currently above its 50-day Simple Moving average and approaching its 200-day SMA. This suggests bullish momentum for LINK in the short term. However, expect a pullback before it continues its surge.
The Relative Strength Index (RSI) reading of 65.73 is slightly into the buy zone but not in the overbought region. It reflects the current market condition as the bears struggle to push down the asset’s price. The MACD (Moving Average…
Click Here to Read the Full Original Article at NewsBTC…


