Cardano (ADA) has notably trailed behind that of its contemporaries in the ongoing crypto bull run. While Bitcoin has surged to record new all-time highs, alongside a suite of other altcoins, ADA remains approximately 77% beneath its peak historical value. However, emerging technical patterns and market dynamics suggest that this trend could be poised for a reversal, with ADA potentially gearing up to narrow the gap.
Cardano Bull Flag Formation: An In-Depth Look
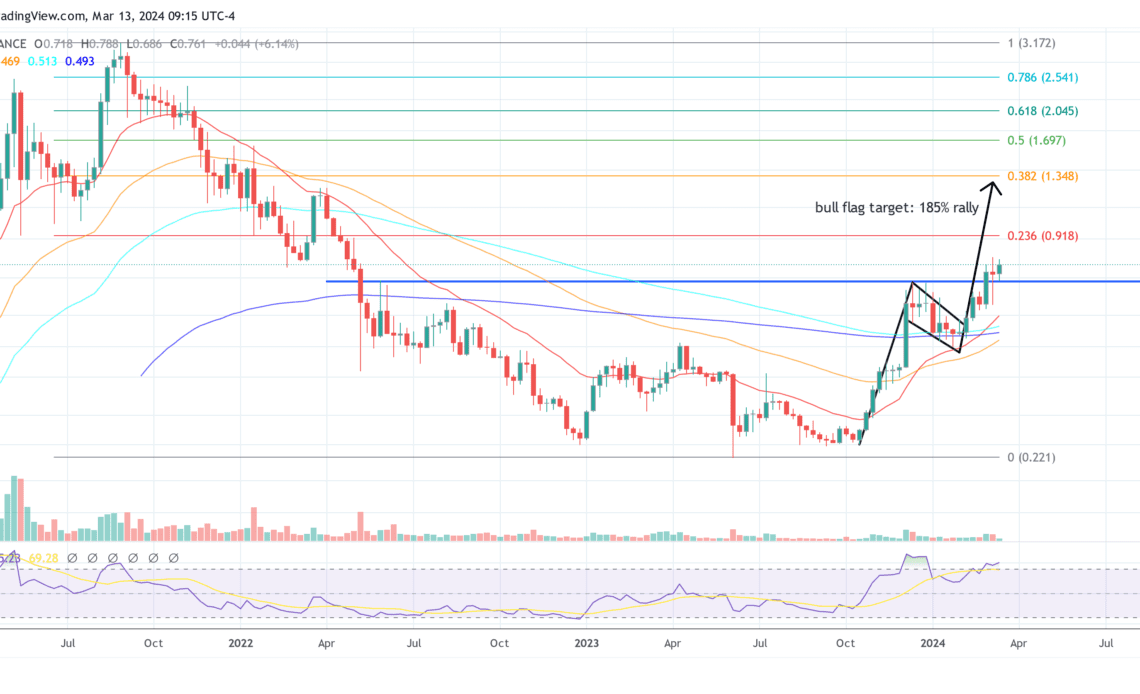
Central to this analysis is the bull flag pattern in the ADA/USD weekly chart. The bull flag pattern observed here is composed of two primary elements: the flagpole and the flag. The flagpole is a significant vertical ascent in price, representing a rapid increase in buying pressure. For ADA, this pole formed from mid-October till mid-December and reflects an approximate 185% surge.
The flag, following the pole, is a period of consolidation with a downward slope, resembling a flag on a pole. For ADA, the pole developed from mid-December to early February. A subsequent breakout above the flag can often lead to a price rally proportionate to the initial pole’s height.
The Cardano price already broke out and surpassed the crucial resistance at $0.685. If ADA further follows this technical playbook, the rally is far from over. The projected target would be an 185% increase from the consolidation zone’s breakout point, placing the price close to the Fibonacci 0.382 retracement level, which is around $1.35.
Remarkably, the Cardano price must first overcome the 0.236 Fibonacci retracement level at $0.92, an area where greater selling pressure and possibly a shorter consolidation can be expected.
Golden Cross And More Bullish Arguments
The chart also teases the formation of a golden cross, a bullish signal where a shorter-term moving average (the 50-week EMA) crosses above a longer-term average (the 200-week EMA). Such crossovers can often signal a shift in momentum from bearish to bullish over the long term, and their significance is heightened on a weekly chart, which filters out short-term market noise.
Traders often view this crossover as confirmation of a trend reversal, with the potential to catalyze sustained buying activity. For ADA, this could be the final confirmation of a strong bull move.
Beyond that, the weekly chart for ADA presents a broader narrative. The Relative Strength Index (RSI) sits…
Click Here to Read the Full Original Article at NewsBTC…


