Bitcoin has observed a plunge during the past day, taking the asset’s price under $67,000. Here’s the historical support level that the asset could visit next.
Bitcoin Is Now Not Far From The Short-Term Holder Realized Price
As analyst James Van Straten pointed out in a post on X, the Realized Price of the Bitcoin Short-Term Holders has been going up recently and currently sits around the $64,000 level.
The “Realized Price” here refers to an on-chain metric that keeps track of the cost basis of the average investor in the BTC market. This indicator is based on the “Realized Cap” model for the cryptocurrency.
Related Reading
When the asset’s spot price is greater than the Realized Price, it means the investors are carrying some net unrealized profits right now. On the other hand, the coin’s value under the metric suggests the dominance of losses in the market.
In the context of the current topic, the Realized Price of a specific sector segment is of interest: the Short-Term Holders (STHs). The STHs include all the investors who bought their coins within the past 155 days.
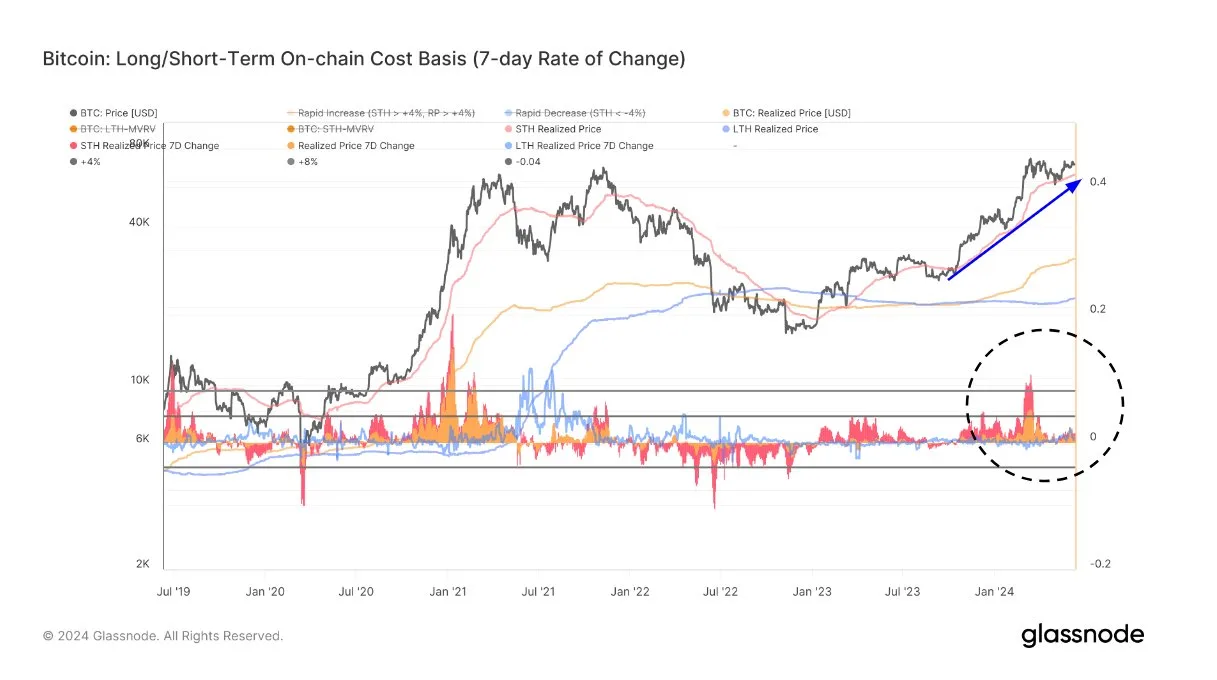
Here is a chart that shows the trend in the Realized Price of the Bitcoin STHs over the last few years:
As displayed in the above graph, the Bitcoin STH Realized Price rapidly climbed during the rally towards the all-time high price (ATH) earlier in the year. This trend naturally makes sense, as the STHs represent the new investors in the market, who would have had to buy at higher prices as the asset climbed up, thus pushing the cohort’s average up.
Since BTC’s consolidation phase following the March ATH, the indicator’s uptrend has slowed, but its value is increasing nonetheless. After the latest increase, the metric has approached $64,000.
Now, what significance does the Realized Price of the STHs have? Historically, this indicator has taken turns acting as a major support and resistance line for the cryptocurrency.
During bullish periods, this metric can facilitate bottom formations for the cryptocurrency, thus keeping it above itself, while bearish trends generally witness the line acting as a barrier preventing the coin from escaping above it. Transitions beyond this level have generally reflected a flip trend for the coin.
This apparent pattern has held up likely because the STHs, being the relatively inexperienced hands, can be quite…
Click Here to Read the Full Original Article at NewsBTC…


