Bitcoin (BTC) faces an uphill struggle to reignite its uptrend after its biggest one-day losses of 2023.
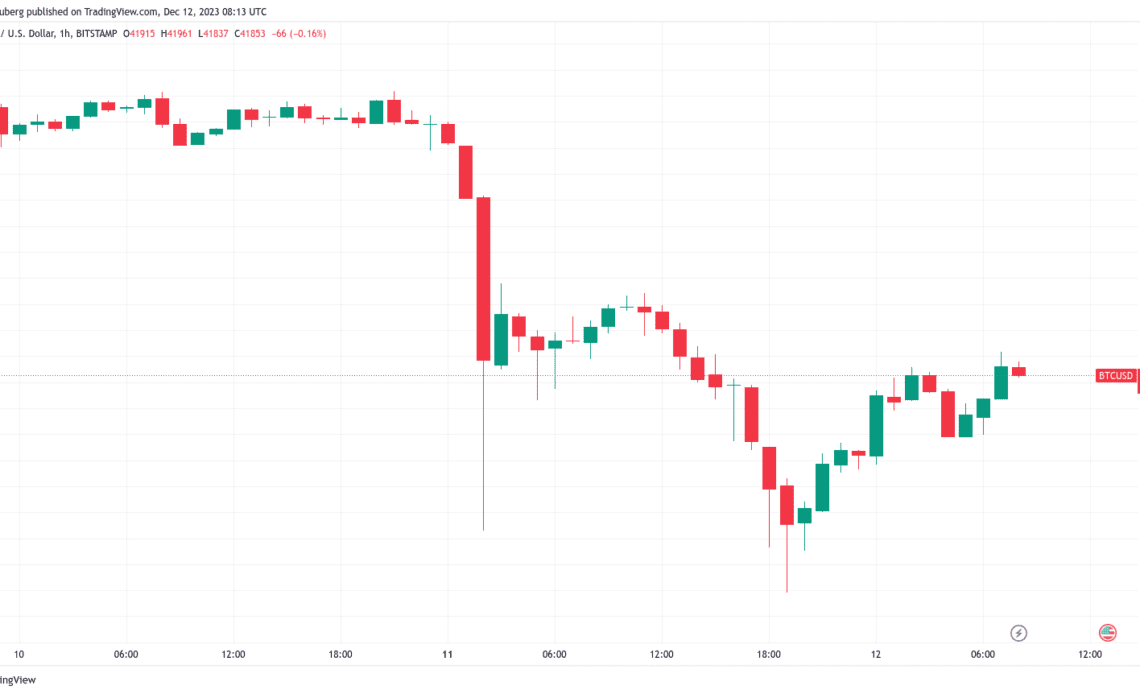
The largest cryptocurrency continues to claw back lost ground after falling to lows of $40,200 after the Dec. 10 weekly close, the latest data from Cointelegraph Markets Pro and TradingView shows.
With BTC price action taking a break from relentless gains — one which many argue was overdue — new key support and resistance levels are coming into play.
The coming days are already set to offer plenty of potential volatility triggers — United States macro data releases begin on Dec. 12, with the Federal Reserve interest rate decision and commentary from Chair Jerome Powell following a day later.
The stage is set for a showdown which may involve more than crypto markets.
Cointelegraph takes a look at some of the popular BTC price lines in the sand now on the radar for traders and analysts as Bitcoin narrowly preserves the $40,000 mark.
Bollinger Bands: BTC bounced “where it was supposed to”
While painful for late longs, the 7.5% BTC price dip which followed the weekly close offered a form of reset for frantic crypto markets.
#Bitcoin has now dropped 7.5% today, which would be the single biggest 1-day drop in 2023.
It has overtaken the drop in March during the banking collapse; -6.2%, bottomed out at $20,000.
Also dropped -7.2% in August when Bitcoin bottomed out at $26,000. pic.twitter.com/WFYiyURO3J
— James Van Straten (@jimmyvs24) December 11, 2023
This was needed, consensus agrees, as unchecked upside typically results in a violent reaction the longer it continues.
“Very overextended, so a pullback was due,” John Bollinger, creator of the Bollinger Bands volatility indicator, argued in a reaction on X (formerly Twitter).
“Stopped right were it was supposed to. That doesn’t happen too often. Now we look to see if support can hold.”

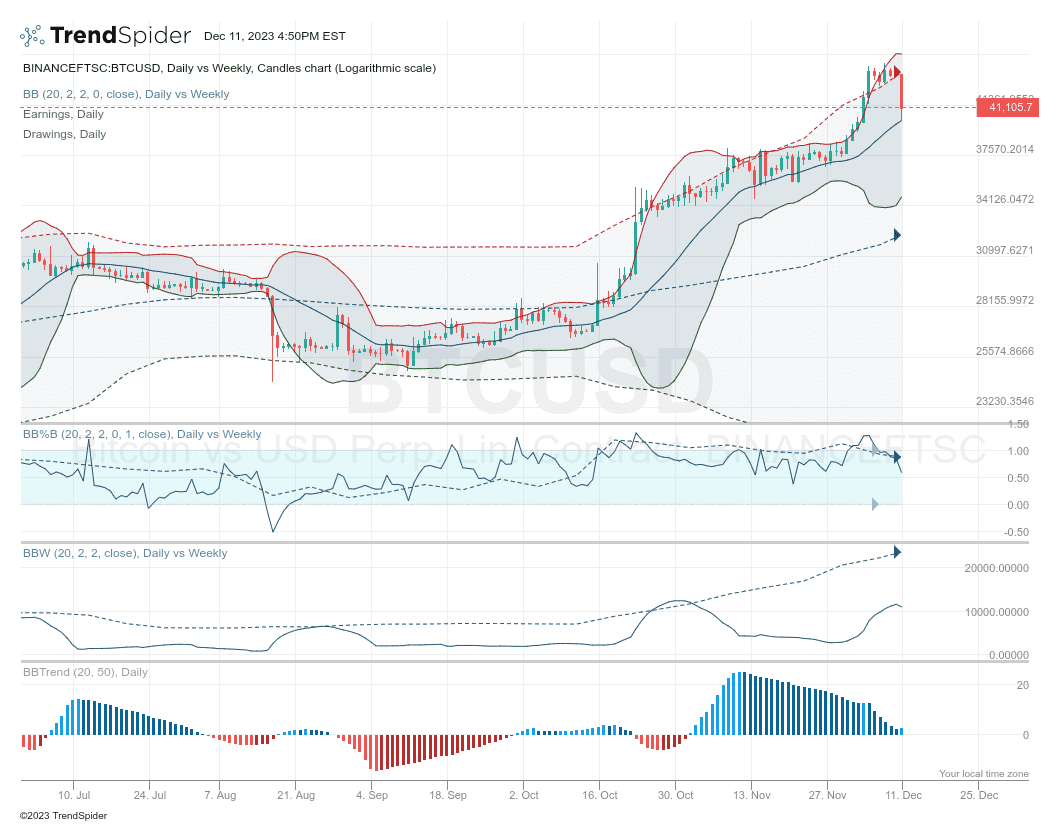
Bollinger referred to Bollinger Bands data, with an accompanying chart showing, among other things, the forcefulness of the latest upside within the context of broader recent BTC price strength.
On daily timeframes, the dip took Bitcoin straight to the middle band within the Bollinger channel, making the correction something of a textbook move and cause for optimism going forward.
The air is getting a bit thin up here, but all we see as of now are signs of strength. We are outside both the daily and…
Click Here to Read the Full Original Article at Cointelegraph.com News…


