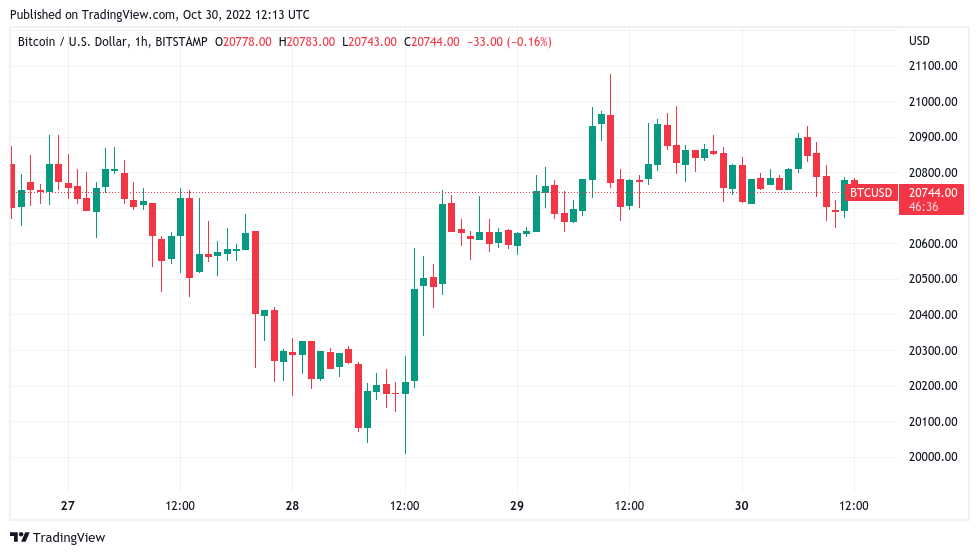
Bitcoin (BTC) continued consolidating into the Oct. 30 weekly close as concerns over a deeper retracement became vocal.
Trader avoids new longs below $21,000
Data from Cointelegraph Markets Pro and TradingView showed BTC/USD circling levels just below $21,000 on the day.
Weekend trading had produced an early return above the $21,000 mark, this short lived as Bitcoin bulls failed to offer the volume to sustain higher levels.
Now, popular trader and analyst Il Capo of Crypto sensed a change of direction was ultimately due for Bitcoin and altcoins alike.
Altcoins themselves had also performed strongly through the weekend, notably led by Dogecoin (DOGE), which was up another 25% in the past 24 hours at the time of writing and at six-month highs.
“In my opinion, top is in for $BTC and $ETH, but some altcoins could pump more,” he wrote in part of a fresh Twitter update.
“Not entering any new long positions and just trailing my stops in profits (altcoins). I will fully TP soon.”
Profit-taking was already a hot topic in recent days, with on-chain indicators suggesting that the temptation would become considerable should Bitcoin pass $21,000 more convincingly.
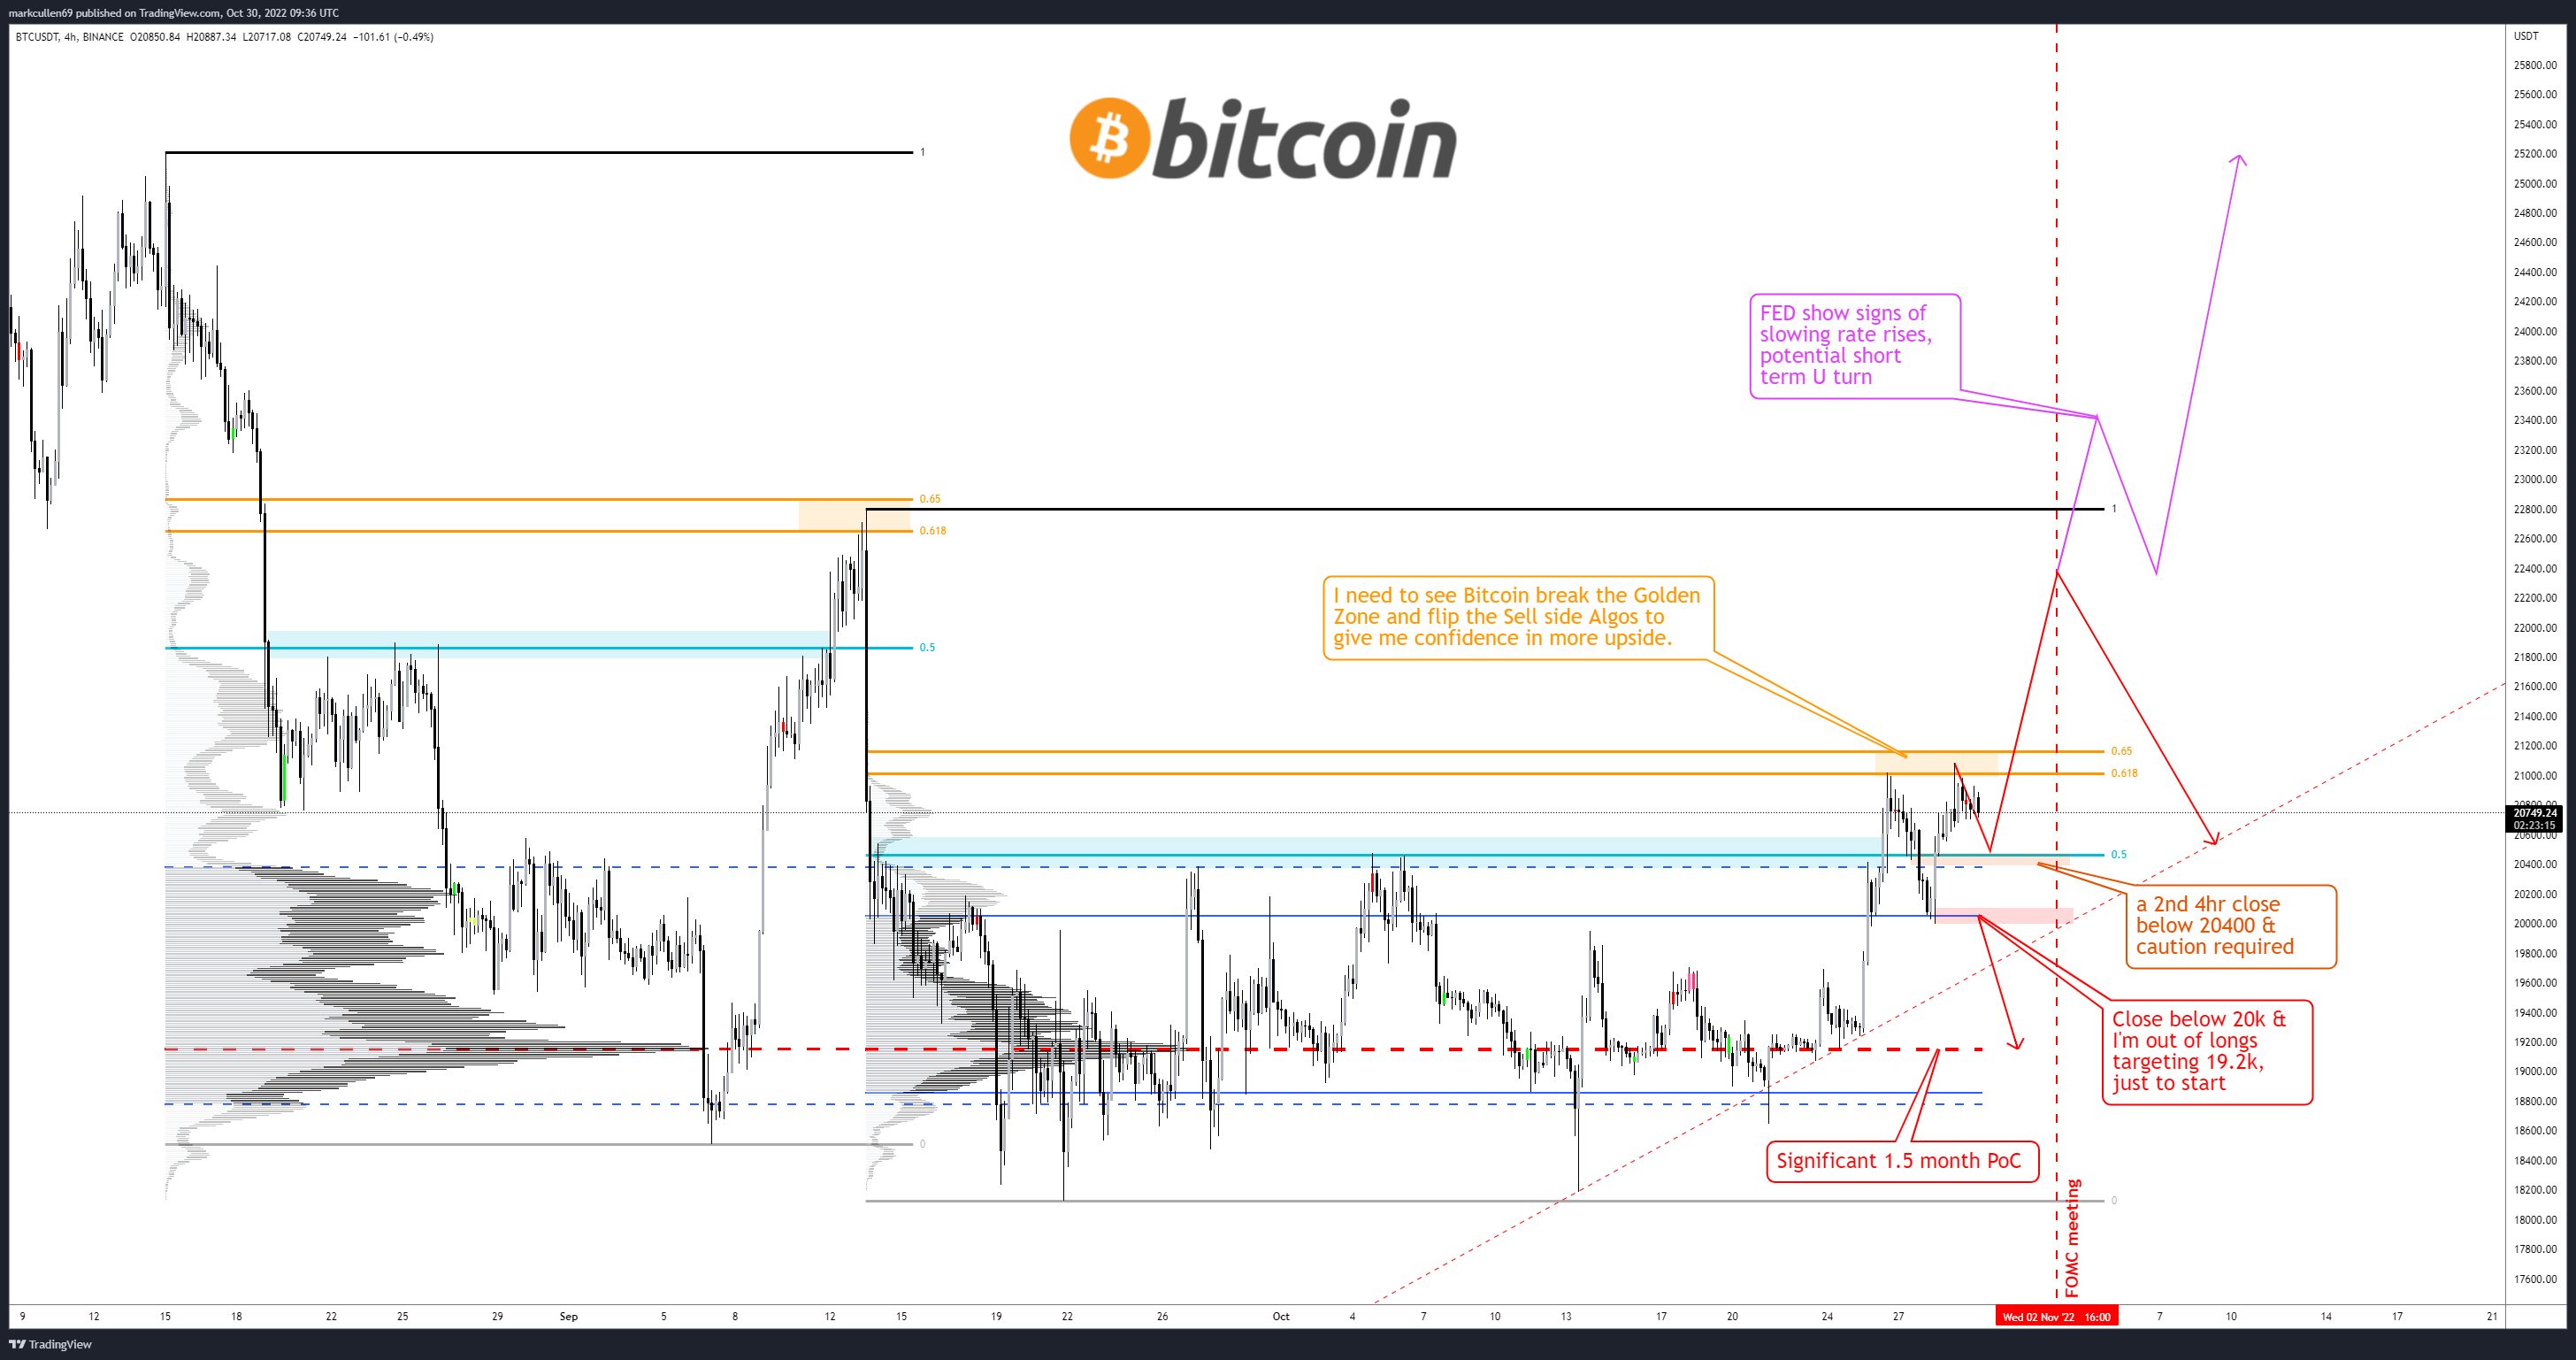
Responding to Il Capo of Crypto, fellow trader Mark Cullen voiced similar caution over the short-term market strength.
Bitcoin, he said, had “spent a bit too long under 21k for my liking, while Alts / ETH in particular have run.”
“BUT, break the golden zone and i would consider a quick push higher first. Lose 20.4k and i start to question everything,” he tweeted.
“Uptober” on track for sideways 7% gains
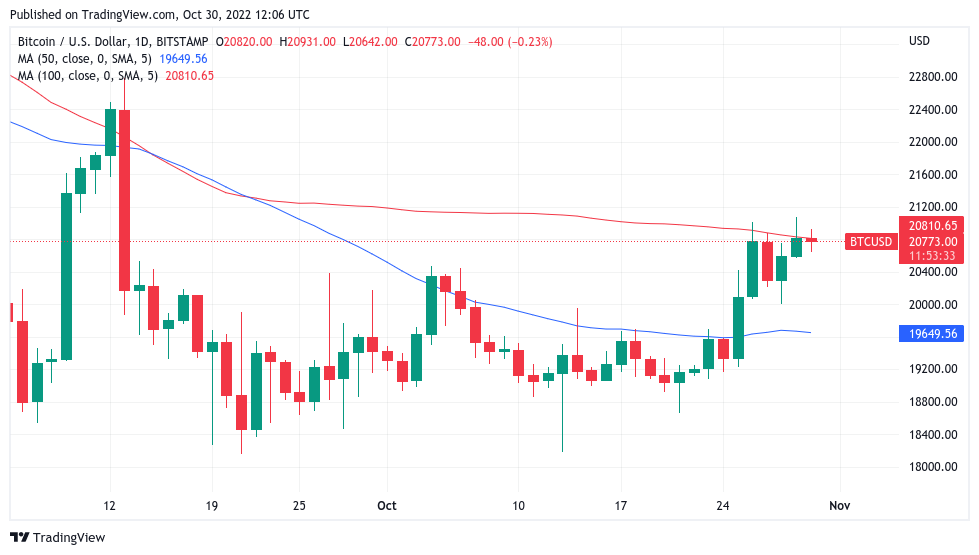
On the daily chart, BTC/USD was up against the 100-day moving average (MA), having managed to beat out the 50-day MA over the week.
Related: Bitcoin price due sub-$20K dip, traders warn amid claim miners ‘capitulating’
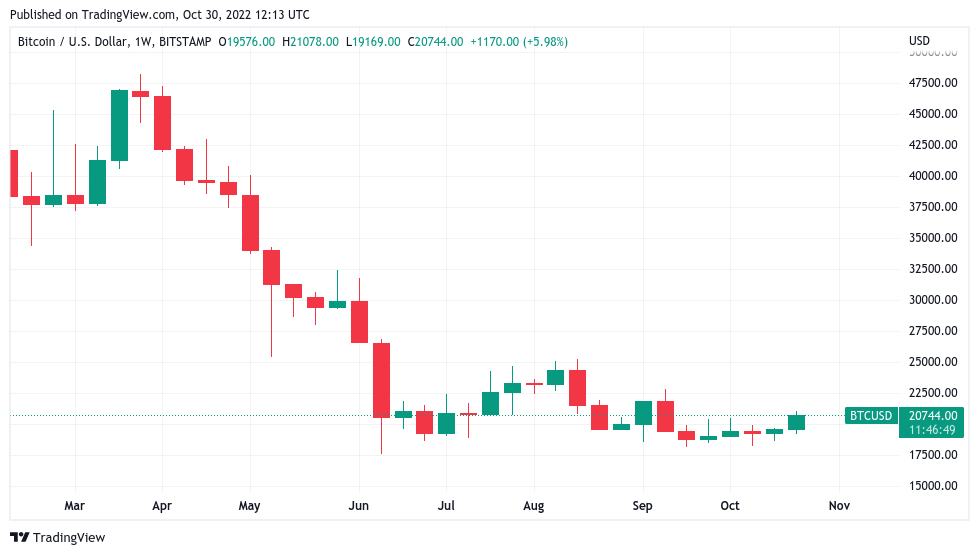
Turning to the weekly and monthly charts, October 30 looked to offer Bitcoin’s highest weekly candle close since mid-September.
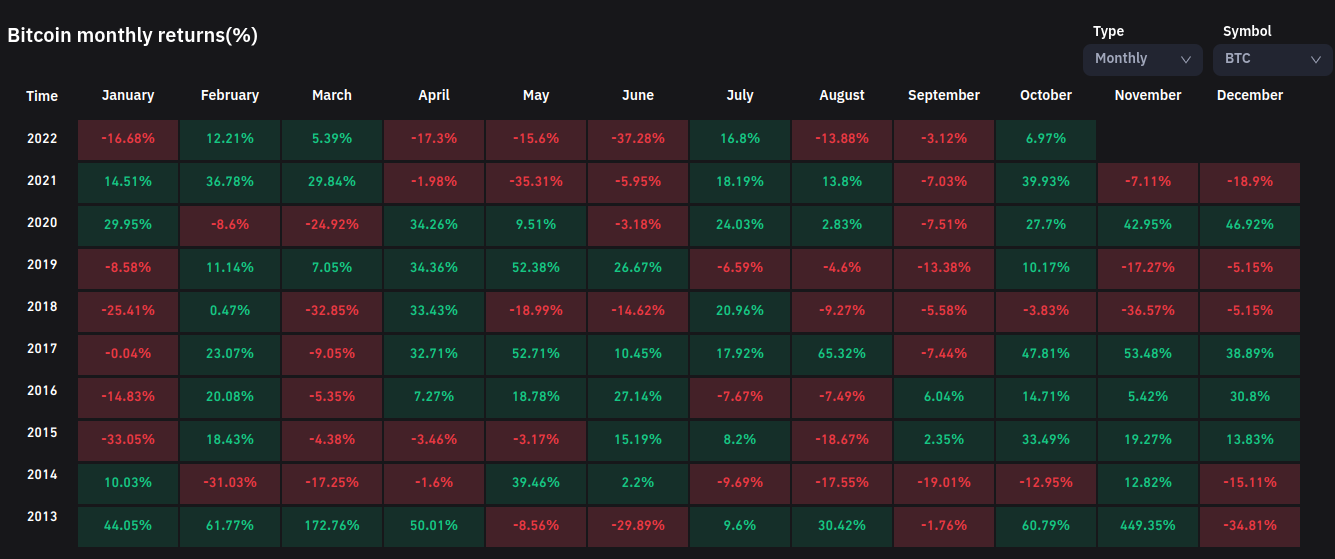
At current prices, Bitcoin was meanwhile up 7% in October, still its third-weakest performance since 2013, according to data tracked by monitoring resource Coinglass.
The views and opinions expressed here are solely those of the author and do not…
Click Here to Read the Full Original Article at Cointelegraph.com News…
