Bitcoin (BTC) continues to trade in a range with the local tops and bottoms coinciding with increased whale activity in the region, according to on-chain analytics resource Whalemap.
The range-bound action in Bitcoin has kept the analysts guessing and a few expect the consolidation to continue for some more time, while others anticipate another leg lower.
A June 6 Glassnode report said that the aggregated realized losses from long-term holders reflected more than 0.006% of the market capitalization on May 29. This is in comparison to the peak of 0.015% of the market capitalization reached during the 2018 to 2019 bear market.
Along with the quantum of losses, investors may also have to be prepared for a longer duration of subdued prices. The duration of the current loss for long-term investors is only one month old, while the previous losses remained roughly for a year.
Could the lackluster trading action in Bitcoin and other major altcoins continue? Let’s study the charts of the top-10 cryptocurrencies to find out.
BTC/USDT
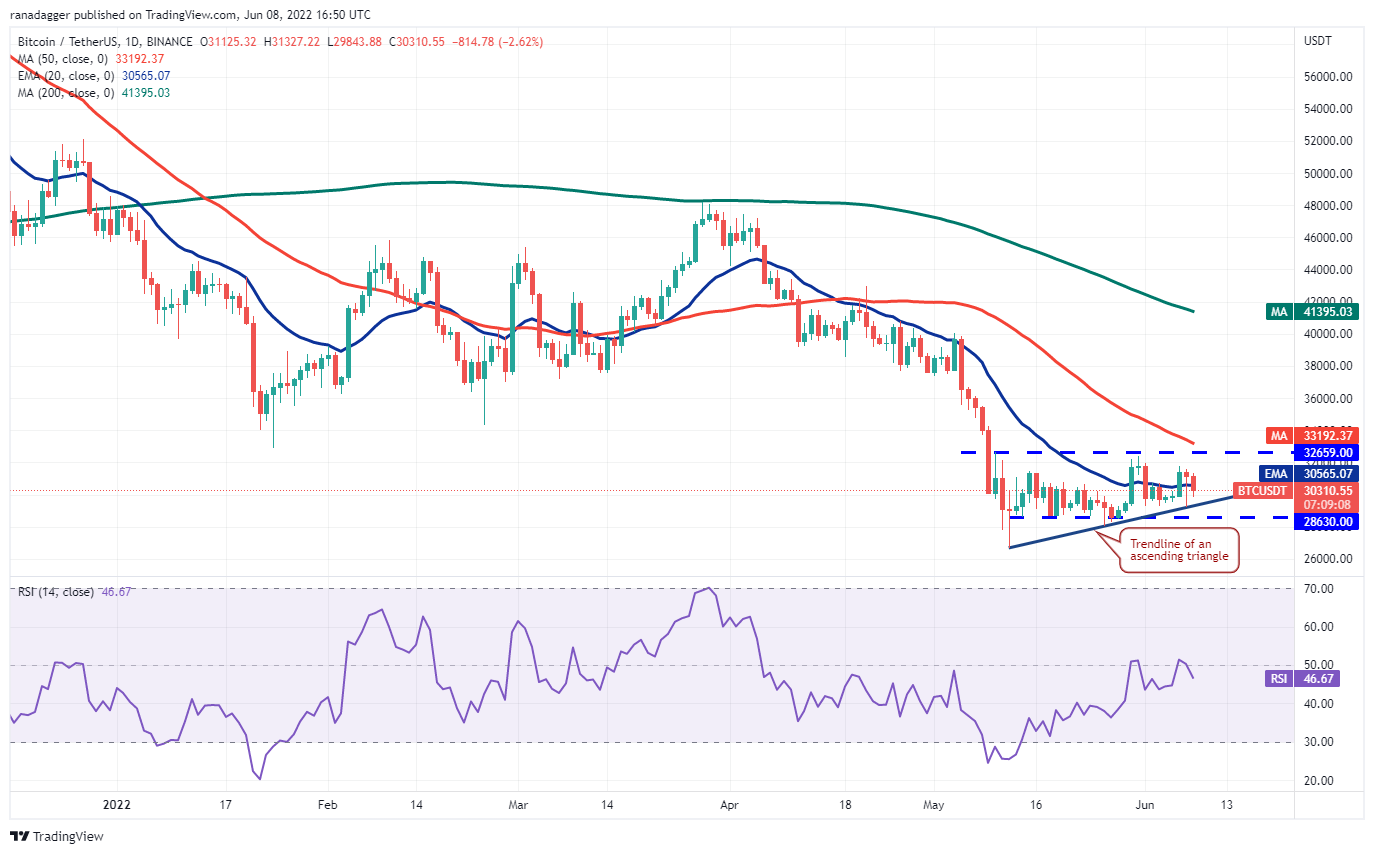
Bitcoin plunged below the 20-day exponential moving average (EMA) ($30,565) on June 7 but a positive sign is that the bulls aggressively purchased the dip to the trendline of the ascending triangle pattern. This resulted in a strong recovery as seen from the long tail on the day’s candlestick. The ascending triangle pattern remains intact favoring the buyers.

However, a minor negative is that the bulls could not build upon the momentum on June 8. This gave an opportunity to the bears who have again pulled the price back below the 20-day EMA. This suggests that bears continue to sell in the zone between the 20-day EMA and $32,659.
If bears sink the price below the trendline, the BTC/USDT pair could drop to $28,630 where buying may emerge. If that happens, it will suggest that the pair may remain range-bound between $32,659 and $28,630 for a few more…
Click Here to Read the Full Original Article at Cointelegraph.com News…


