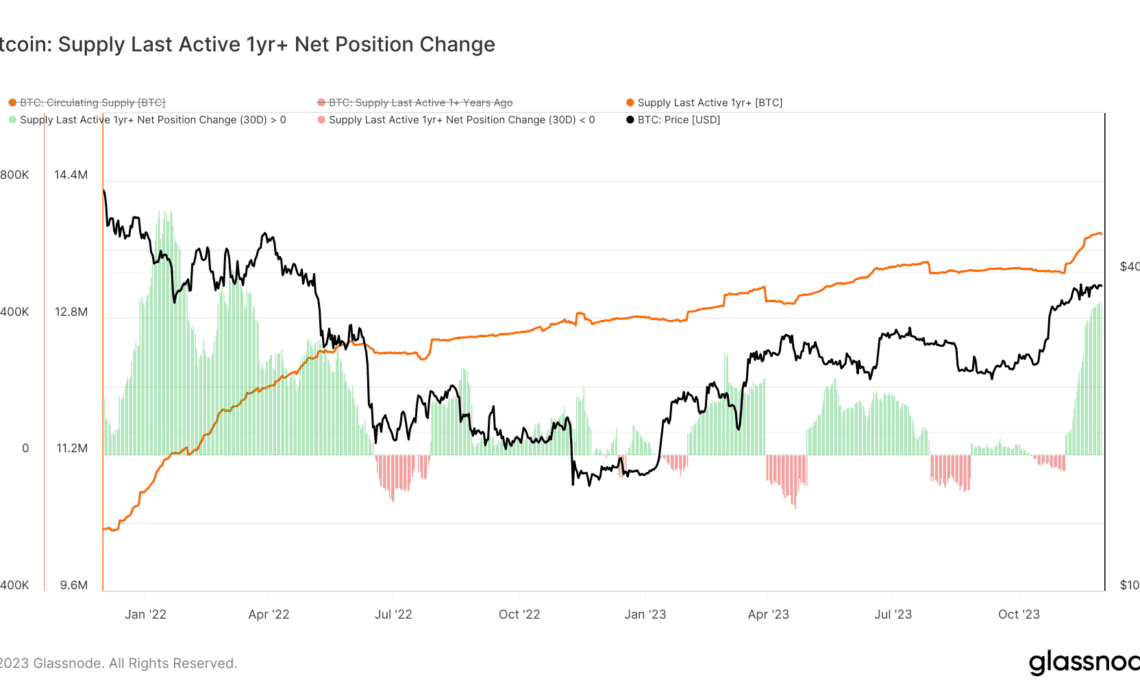
Bitcoin’s ‘supply last active over a year ago’ is a barometer for long-term holding trends and market liquidity. This metric reflects the quantity of Bitcoin that has remained dormant, without transactions or movements, for over a year. Its significance lies in revealing the propensity of investors to hold their assets for extended periods, a behavior that directly impacts the liquidity available in the market.
A high number of long-term holdings typically indicates a reduction in the active supply of Bitcoin for trading, thereby influencing the liquidity and, consequently, the volatility in the market.
On Nov. 30, the amount of Bitcoin that hadn’t been moved or transacted for over a year soared to an all-time high of 13.78 million BTC. This milestone is not just a statistical anomaly but a significant indicator of the changing contours in the Bitcoin market.
To contextualize this development, it is essential to consider the data points over the year. On Nov. 9, 2022, during the collapse of FTX and the subsequent market frenzy, the supply last active over a year ago was recorded at 12.73 million BTC. This number saw a marginal increase to 12.8 million BTC by Jan. 1, 2023, as traders slowly stopped moving their coins and the market cooled.
However, by Nov. 3, 2023, it had escalated to 13.32 million BTC, setting the stage for the record-breaking figure observed at the end of November. This consistent increase underscores a growing propensity among Bitcoin holders to adopt a long-term investment approach.
The implication of this trend is manifold. Primarily, it signals a strong inclination among a significant portion of Bitcoin investors to hold onto their assets, potentially due to a belief in the long-term appreciation of Bitcoin or as a strategy to use Bitcoin as a store of value. This inclination towards holding reduces the active trading supply, potentially leading to decreased liquidity in the market. Lower liquidity, in turn, can result in increased price volatility, as each transaction carries more weight in determining market prices.
A notable aspect of this trend is the 30-day net position change as of Nov. 30, 2023, where an addition of +447,228 BTC to the supply last active over a year. This was the highest 30-day change since May 19, 2022, which starkly contrasts with the -43,417 BTC change recorded on…
Click Here to Read the Full Original Article at Bitcoin (BTC) News | CryptoSlate…


