
The market value to realized value (MVRV) ratio is one of the most important indicators for analyzing the Bitcoin market. It measures the ratio between the market cap (the current price of Bitcoin multiplied by the total number of coins in circulation) and the realized cap (the sum of the value of all coins in circulation at the price they were last moved).
While there are many uses for the MVRV ratio depending on which metric they’re analyzed with, it essentially provides insight into whether Bitcoin is undervalued or overvalued at a given time.
A higher MVRV ratio suggests that Bitcoin’s price is potentially overvalued, as it indicates the realized value is higher than the market value, which means investors are holding onto unrealized profits. An increase in unrealized profits leads to increased sell pressure as a significant portion of those investors are bound to capitalize on their gains.
Conversely, a lower MVRV ratio can indicate an undervalued market with minimal sell pressure, as investors aren’t holding unrealized gains. This ratio becomes even more important when applied to long-term holders (LTHs) and short-term holders (STHs), as the difference between their MVRV ratios can offer invaluable insights into market sentiment and future price movements.
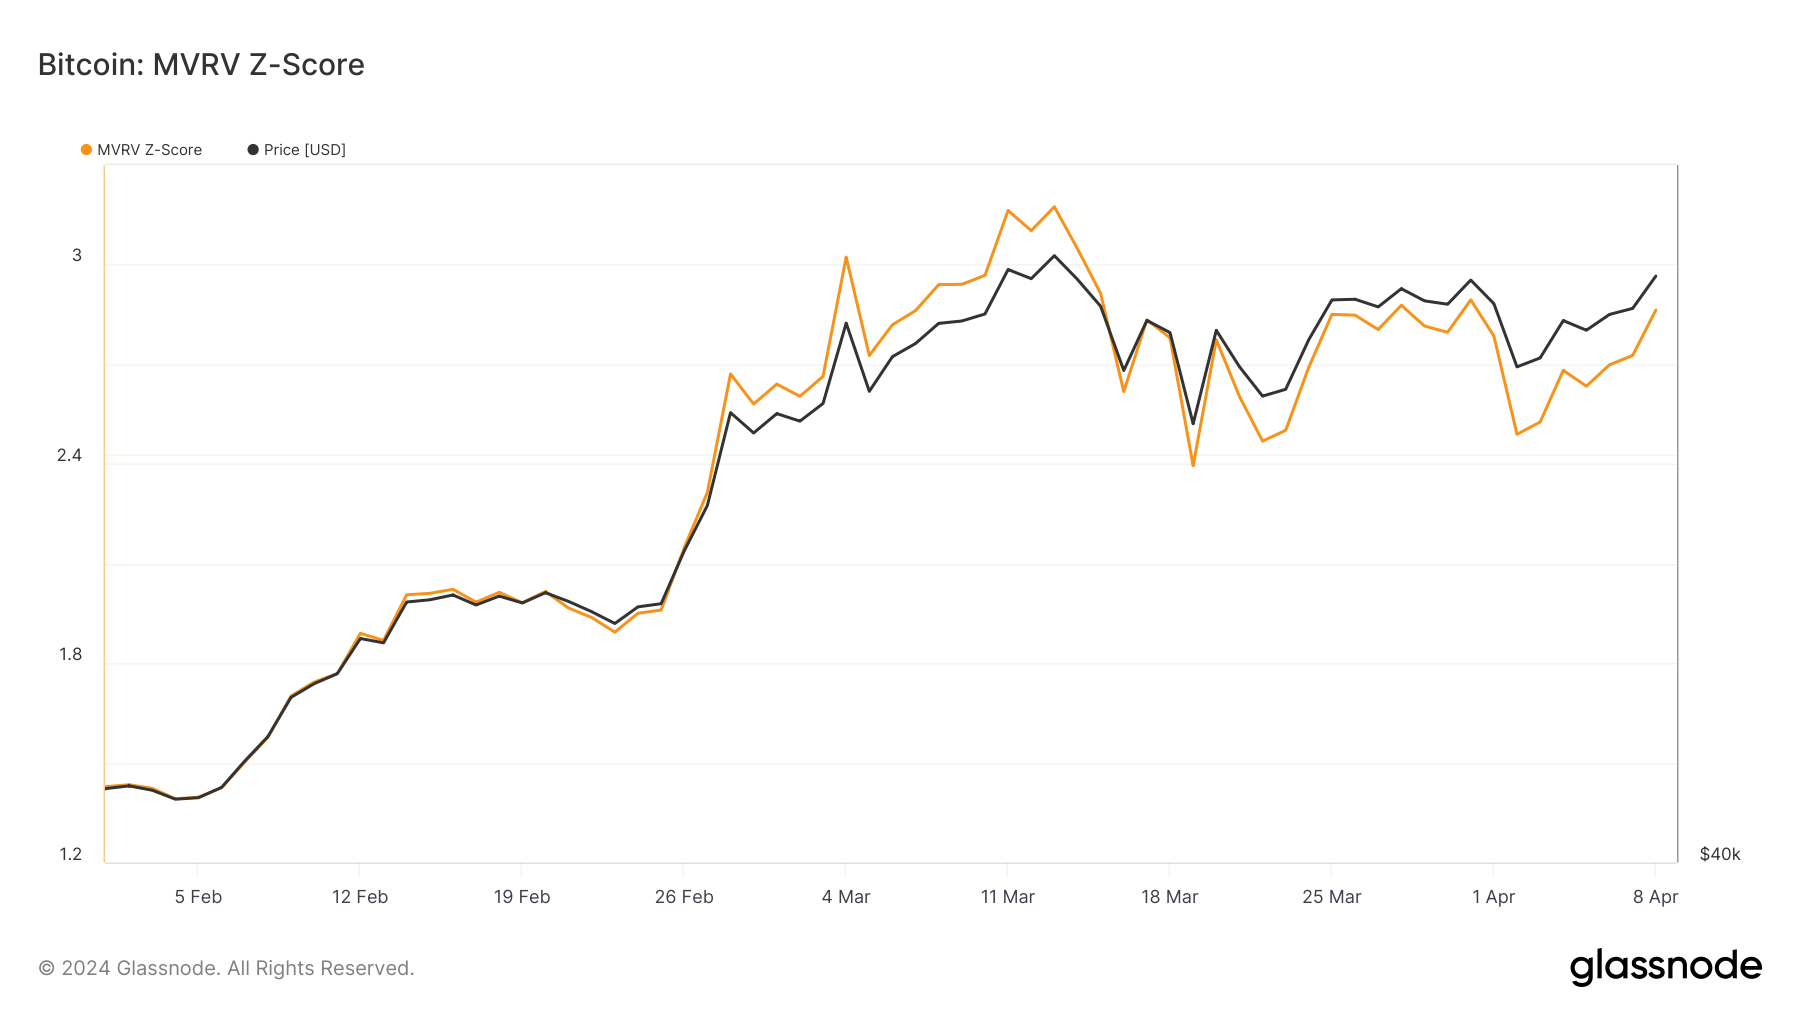
CryptoSlate’s analysis of Glassnode data showed that changes in the MVRV ratio mirrored Bitcoin’s price volatility in the past six weeks. The ratio fluctuated alongside Bitcoin’s price, which peaked at $73,104 on Mar. 18 and was followed by volatility that saw it adjust down to $61,000 before finding footing at above $71,600 on April 8. The MVRV ratio peaked at 2.751 on March 13 as well.
The MVRV ratio Z-score, which standardizes the MVRV ratio to identify extremes of market value compared to realized value, provides a clearer picture of the relationship between Bitcoin’s market cap and realized cap. With values peaking alongside both the MVRV ratio and Bitcoin’s price, it reinforces the notion of potential overvaluation at these points.
As both the general ratio and the Z-score decreased notably since their peak on March 13, it suggests the period saw increased speculative activity and profit-taking.
Diving deeper into the behavior of LTHs and STHs helps us understand which segment of the market saw the most…
Click Here to Read the Full Original Article at Bitcoin (BTC) News | CryptoSlate…


