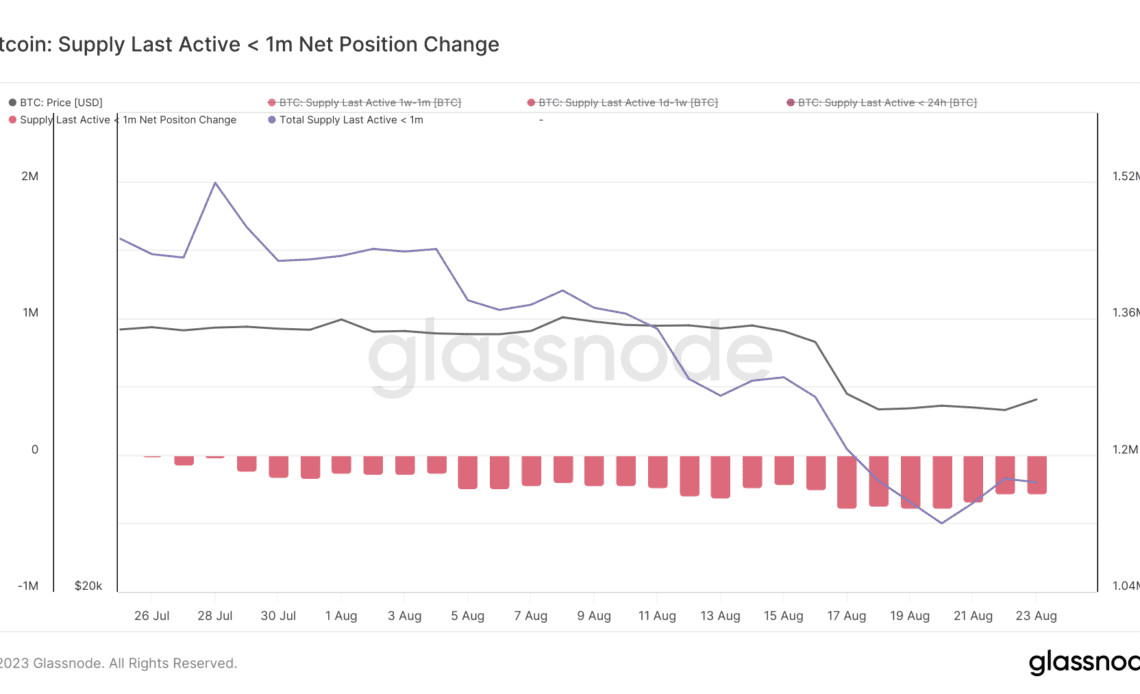
Bitcoin’s supply last active less than a month ago has plummeted to an 8-year low. This often overlooked metric provides essential insights into the market’s current dynamics and is useful when analyzing historical trends.
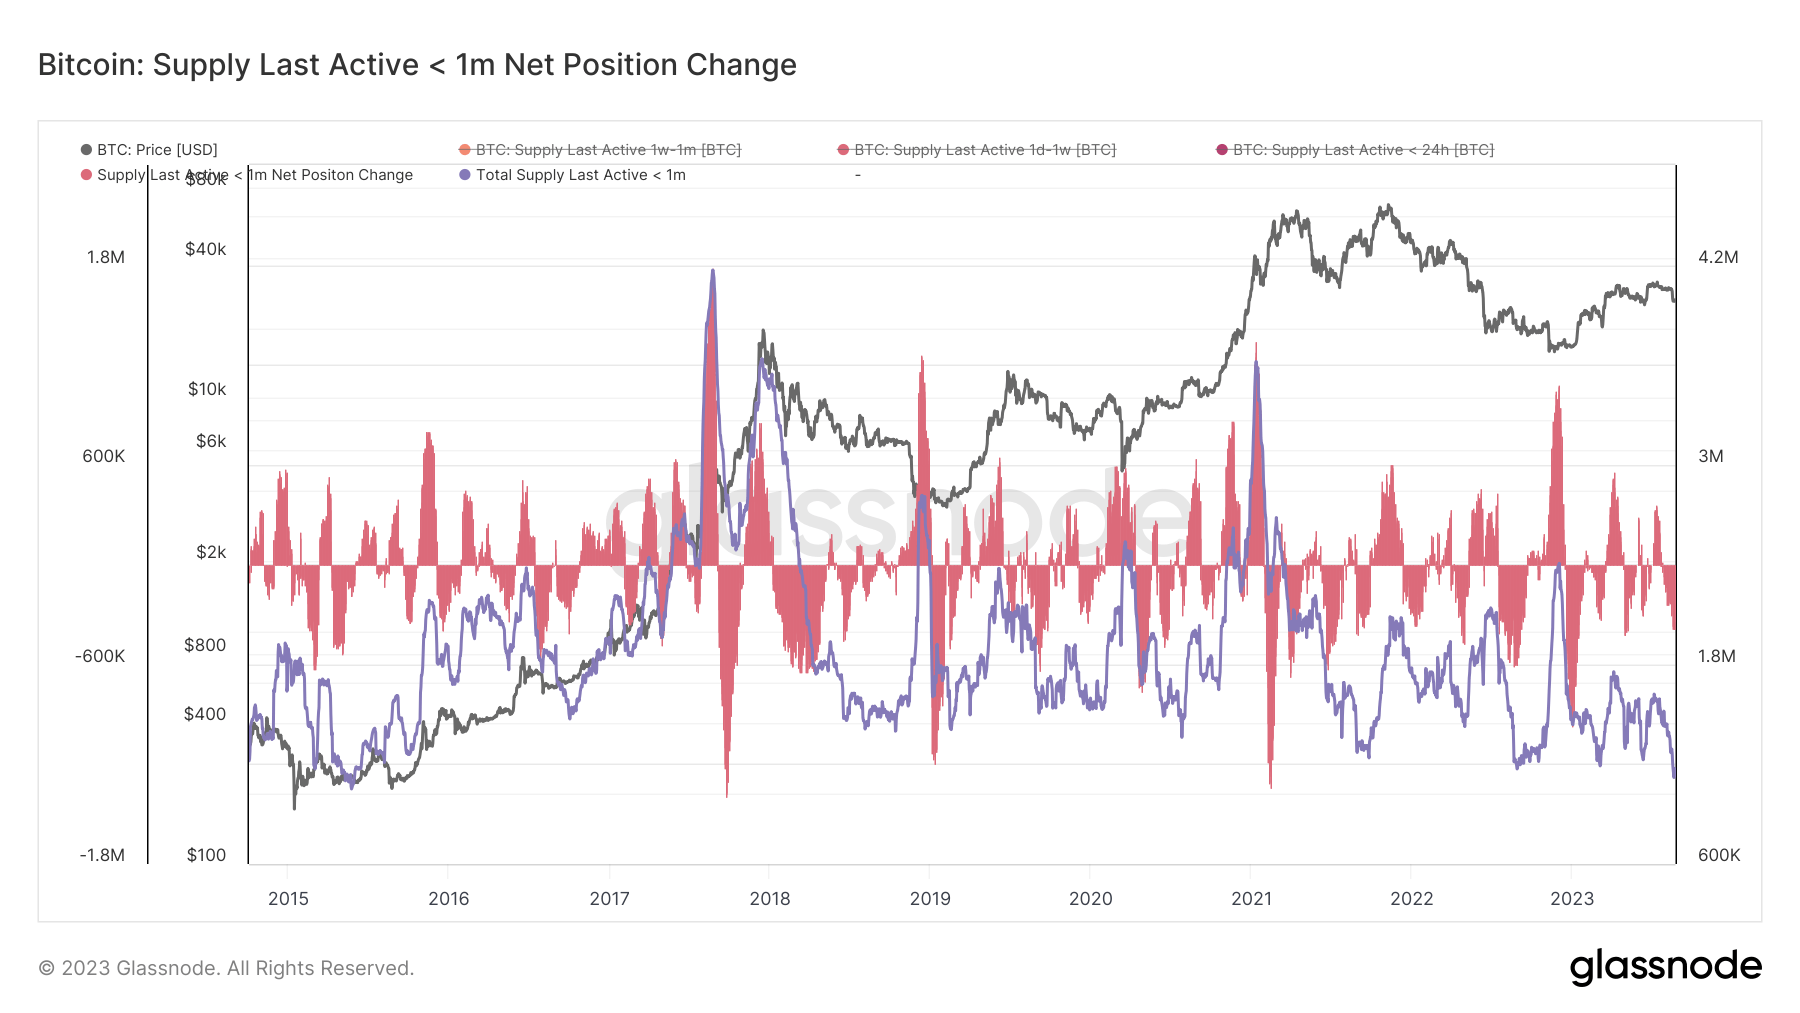
Bitcoin’s supply dynamics are helpful when analyzing the market, as they provide a window into the trading behavior of its vast user base. Bitcoin’s supply last active less than a month ago has historically been the most volatile part of its supply, representing the majority of day-to-day transaction activity. Its movement, or lack thereof, can be an indicator of broader market trends.
On Aug. 20, the total supply of Bitcoin last active less than a month ago dropped to 1.12 million BTC. This represents a notable decline from the 1.28 million BTC it recorded on Aug. 14. During that time, Bitcoin’s price dropped from $29,400 to $26,200.
The rapid decline culminated in the supply reaching its lowest point in 8 years.
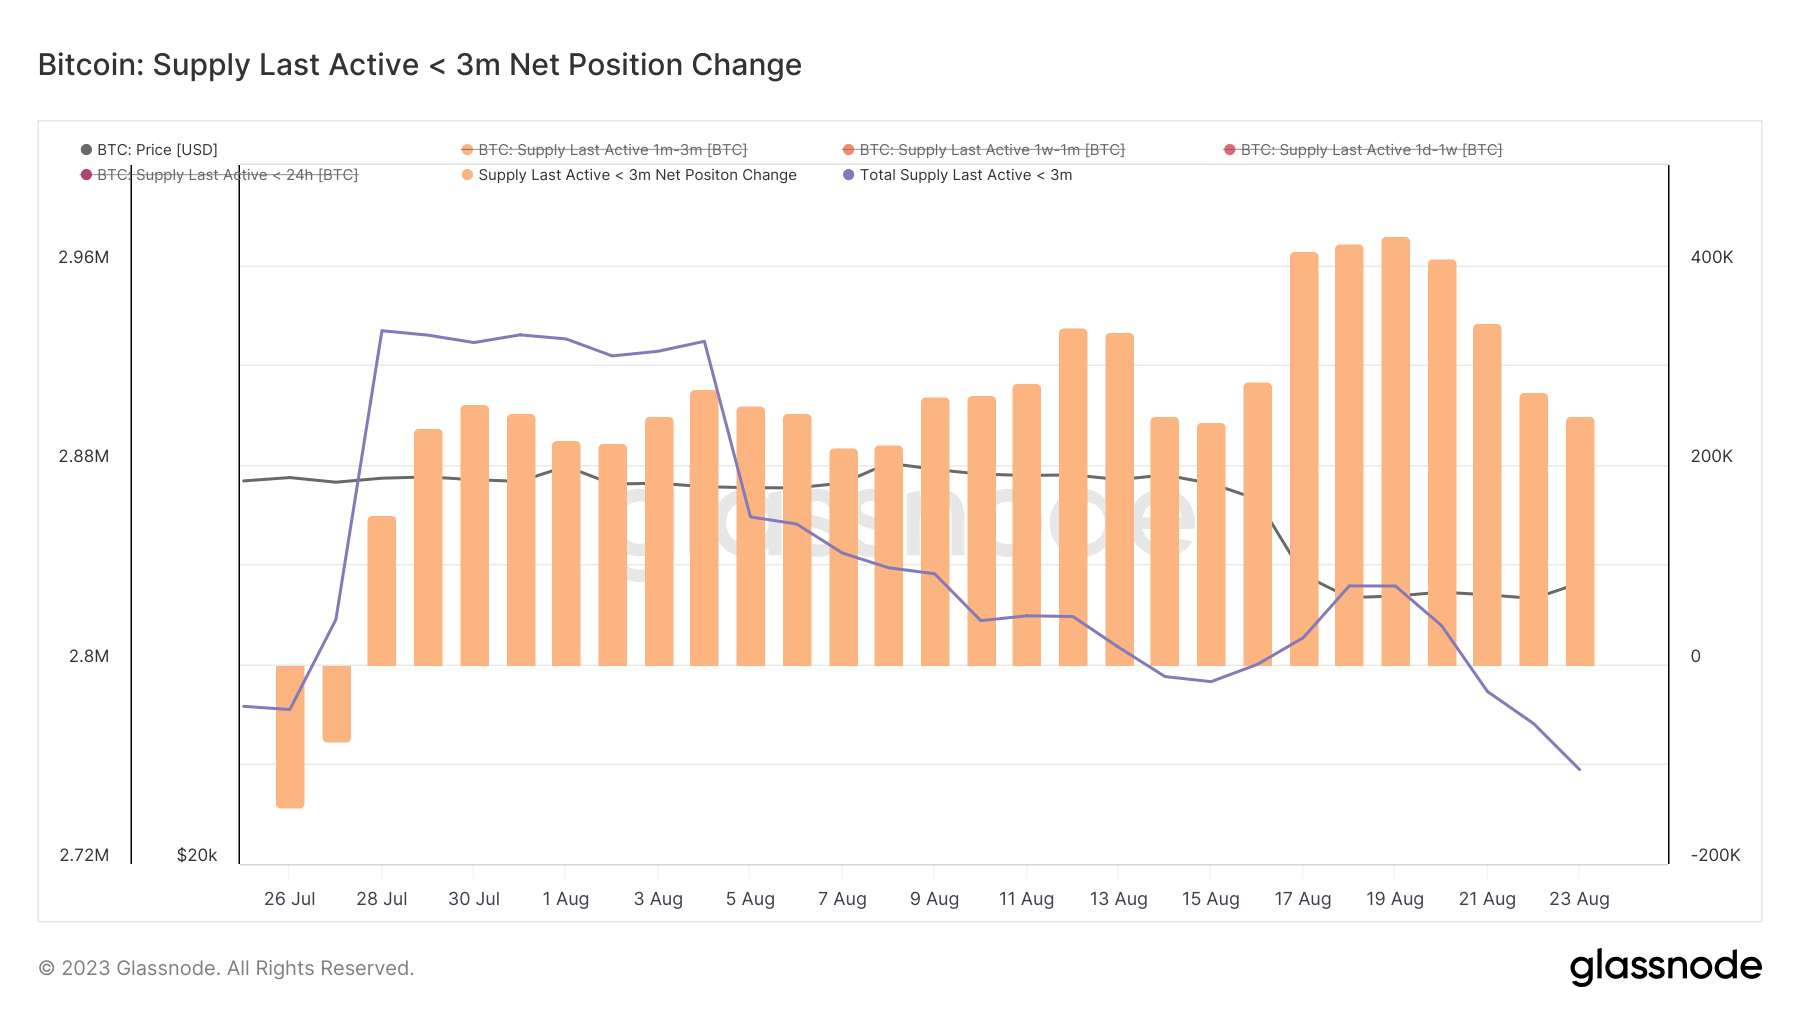
Data from Glassnode further revealed that the supply last active less than 3 months ago also experienced a slight dip, moving from 2.79 million BTC on August 14th to 2.75 million BTC by August 23rd.
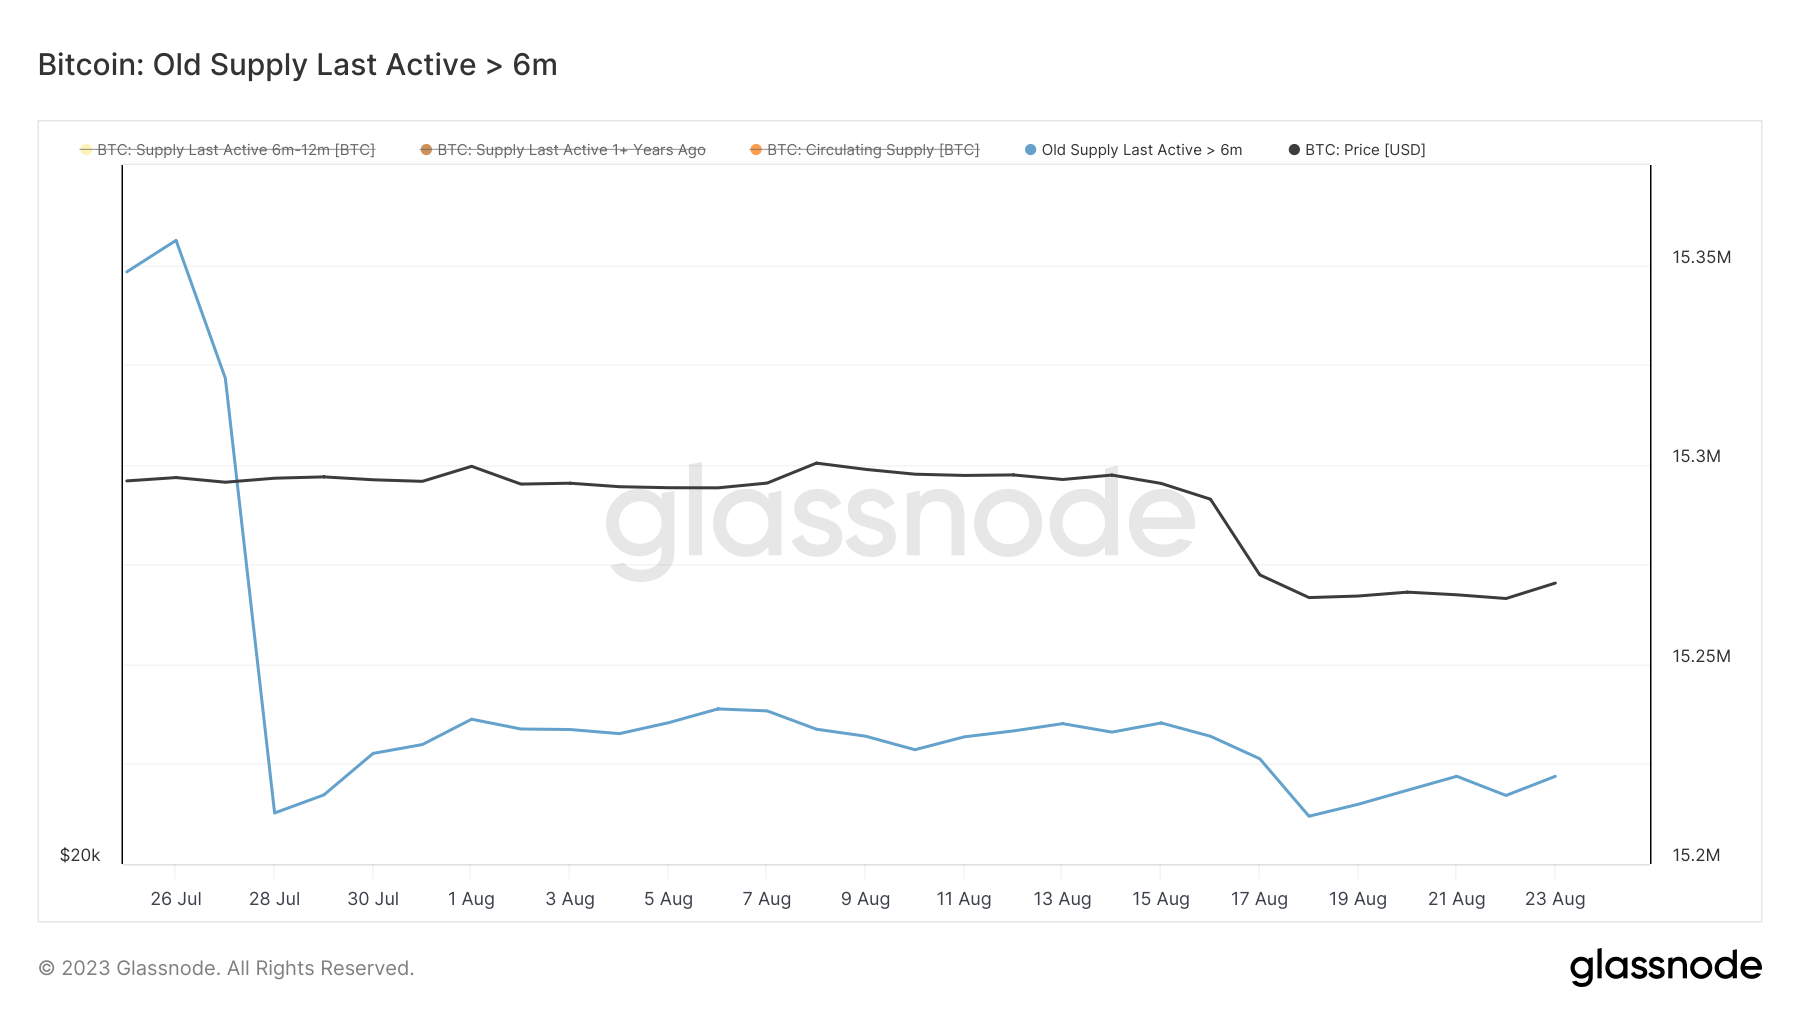
Interestingly, the supply last active more than 6 months ago remained relatively stable, even as Bitcoin’s price faced a slump. This stability in the longer-term active supply suggests that while short-term traders might be adjusting their positions, long-term holders remain unfazed by the price fluctuations.
The significant decrease in “hot coins” points to a decrease in day-to-day trading activity. Fewer coins moving suggests that traders and investors are moving from actively transacting with BTC to holding the coins.
In 2023, the market has seen a clear correlation between the decrease in the supply of these hot coins and drops in Bitcoin’s price. Conversely, an increase in this supply often correlated with an increase in Bitcoin’s price.
The current trend of decreased Bitcoin activity could be interpreted in several ways. It might suggest a stabilization in the market, with fewer participants…
Click Here to Read the Full Original Article at Bitcoin (BTC) News | CryptoSlate…


