In this episode of NewsBTC’s daily technical analysis videos, we take a closer look at a variety of bullish signals in Bitcoin that fired with the most recent weekly open. However, the cryptocurrency market isn’t out of the woods, as this week must confirm the signals with a strong close.
Take a look at the video below:
VIDEO: Bitcoin Price Analysis (BTCUSD): September 12, 2022
Last night we had a weekly close in Bitcoin and have already added nearly 3% on top of around 16% from the lows swept during last week’s candle. As a result of the move, several bullish signals have fired on the candle open. But it is imperative that BTCUSD remains above current levels to confirm the signals with a full weekly candle close.
Examining The BTCUSD Weekly Buy Signals
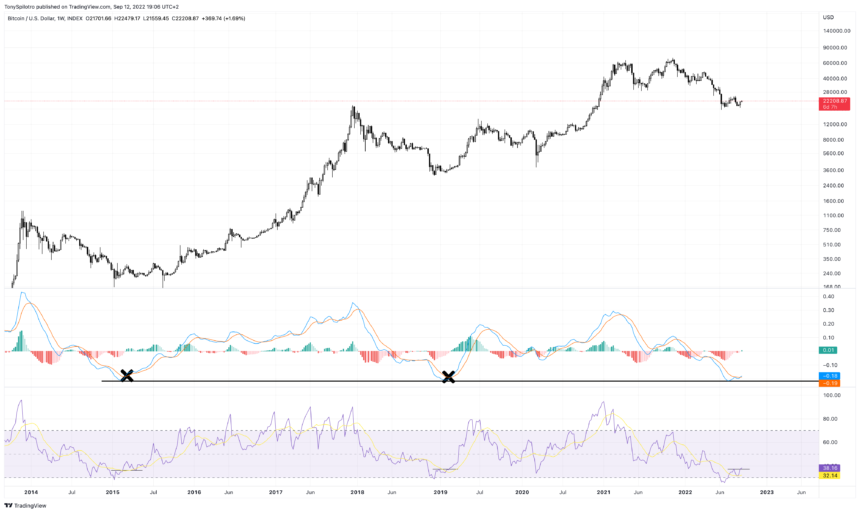
The weekly opened with a bullish crossover of the LMACD. Even a weekly candle close and a confirmed crossover can be a trap, as we have seen on the way down in BTCUSD weekly charts. However, it is where the crossover is happening from that is particularly notable.
Bullish crossovers of the LMACD during past bear markets at such a level have resulted in a long term bottom and sustained bull run. Momentum in both the 2018 and 2014 bear markets fell to the same level.
BTCUSD weekly is also working on a buy signal on the Relative Strength Index, according to the tool’s creator, J. Welles Wilder Jr. The buy signal is activated when the RSI falls below oversold conditions, then rises from below the threshold.
If at the next pullback, the RSI doesn’t revisit oversold conditions, we have one important factor in generating the buy signal. The RSI must then make a higher high. Comparison with the 2018 bear market bottom shows this exact behavior and its impact.
Comparing past Bitcoin bear market buy signals | Source: BTCUSD on TradingView.com
Reversal Targets Retest Of $32,000 Support Turned Resistance
If at all the bottom in Bitcoin is in, the next logical target would first be closing above the middle-Bollinger Band, and then pushing to the opposite side of the bands at roughly $32,000.
On the Ichimoku, the Kijun-sen is just about at the same level as the upper Bollinger Band, highlighting a clear level of importance on weekly timeframes. Much like the last bear market, Bitcoin has just taken the Tenkan-sen, and a cloud twist occurred after a bottom was already in.
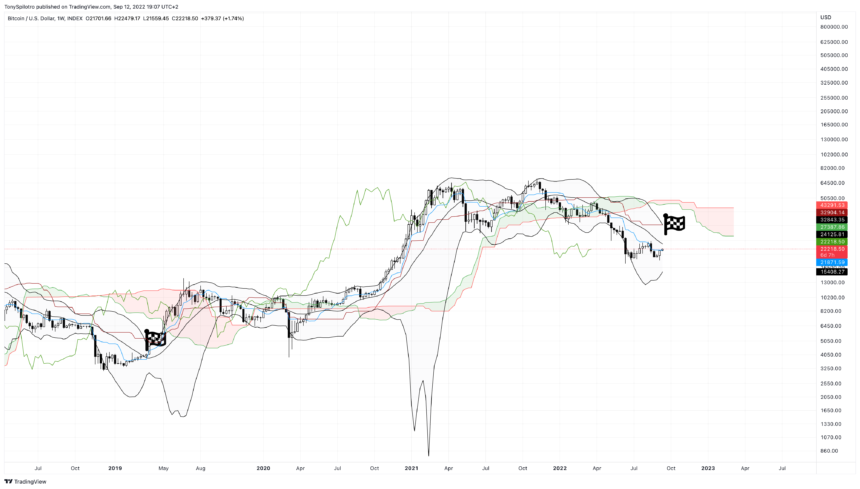
Indicator dynamic resistance could give a...
Click Here to Read the Full Original Article at NewsBTC…


