Gold and stocks have underperformed in 2022, but the year has been difficult for Bitcoin (BTC) investors, in particular.
Worst year for Bitcoin since 2018
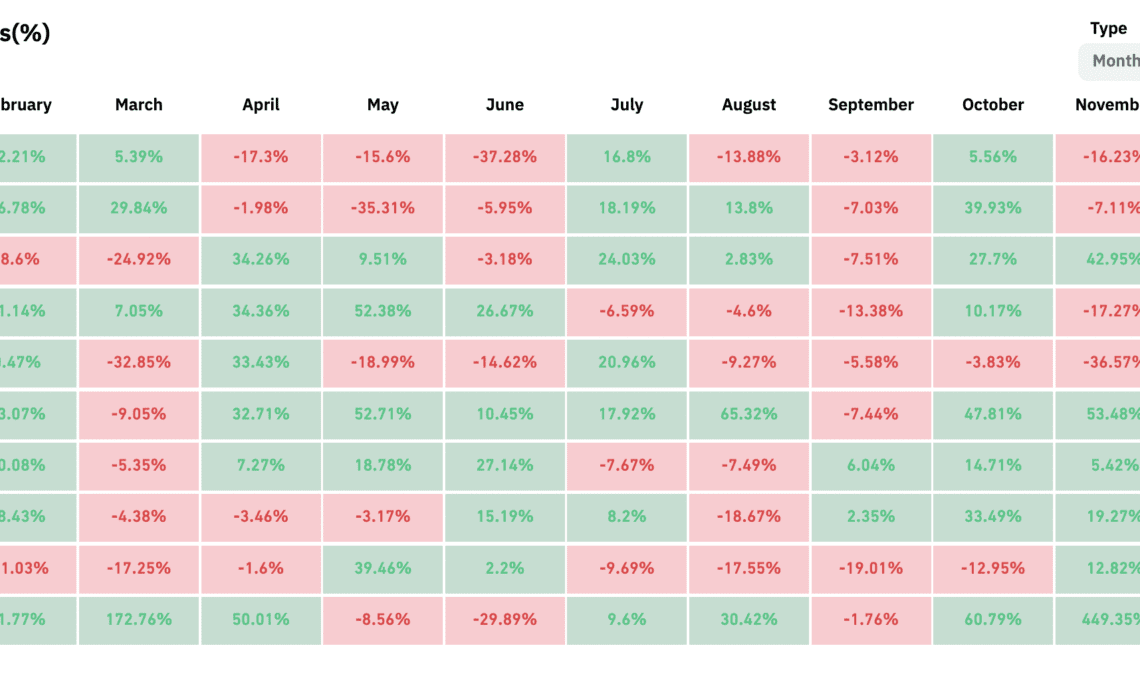
Bitcoin price looks prepared to close 2022 down nearly 70% — its worst year since the crypto crash of 2018.
BTC’s depressive performance can be explained by factors such as the Federal Reserve hiking interest rates to curb rising inflationary pressures, followed by the collapse of many crypto firms, including Terra, Celsius Network, Three Arrow Capital, FTX, and others.
Some companies had exposure to defunct businesses, typically by holding their native tokens. For instance, Galaxy Digital, a crypto-focused investment firm founded by Mike Novogratz, confirmed a $555 million loss in August due to holding Terra’s native asset LUNA, which has crashed 99.99% YTD.

Meta, Tesla stocks mirror Bitcoin in 2022
The above catalysts have prompted Bitcoin to drop 65% year-to-date (YTD).
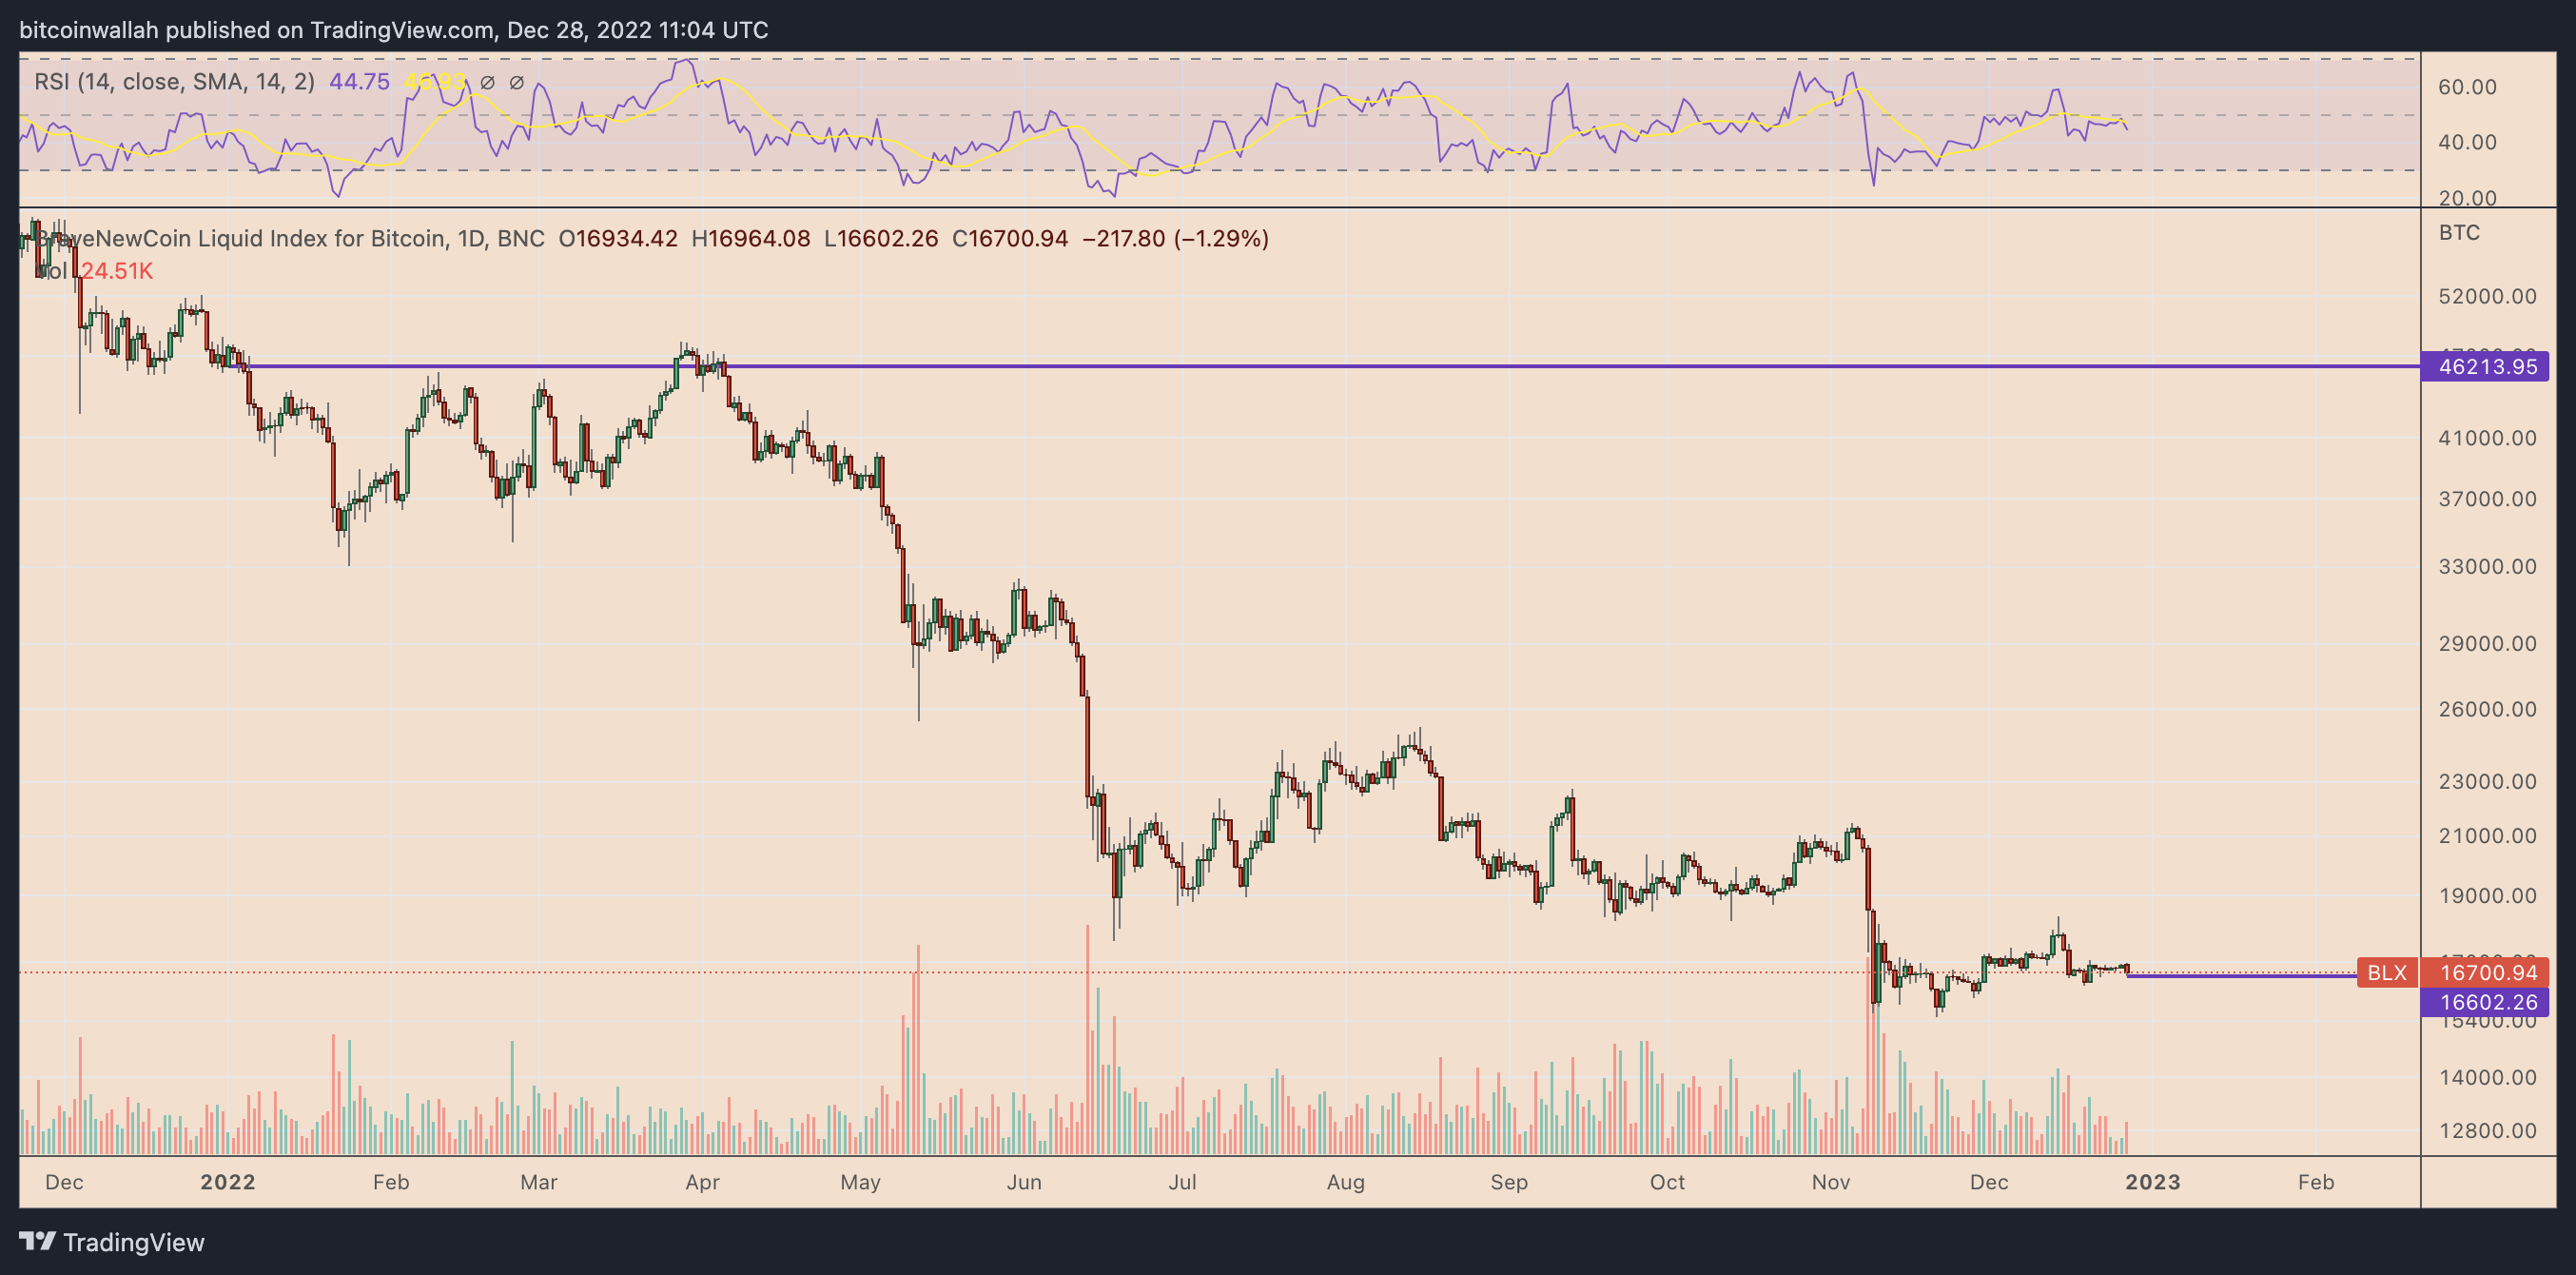
Meanwhile, the U.S. benchmark S&P 500 has plunged nearly 20% YTD to 3,813 points as of Dec. 28. That puts the index on its biggest calendar-year drop since the 2008 economic crisis. The bloodbath has proven to be worse for the tech-heavy Nasdaq Composite, down 35% YTD.
High-profile losers include Amazon, which has crashed approximately 50% YTD, as well as Tesla and Meta , whose stocks have dropped nearly 72.75% and 65%, respectively. As it looks, tech stocks and Bitcoin have suffered similar losses in 2022.
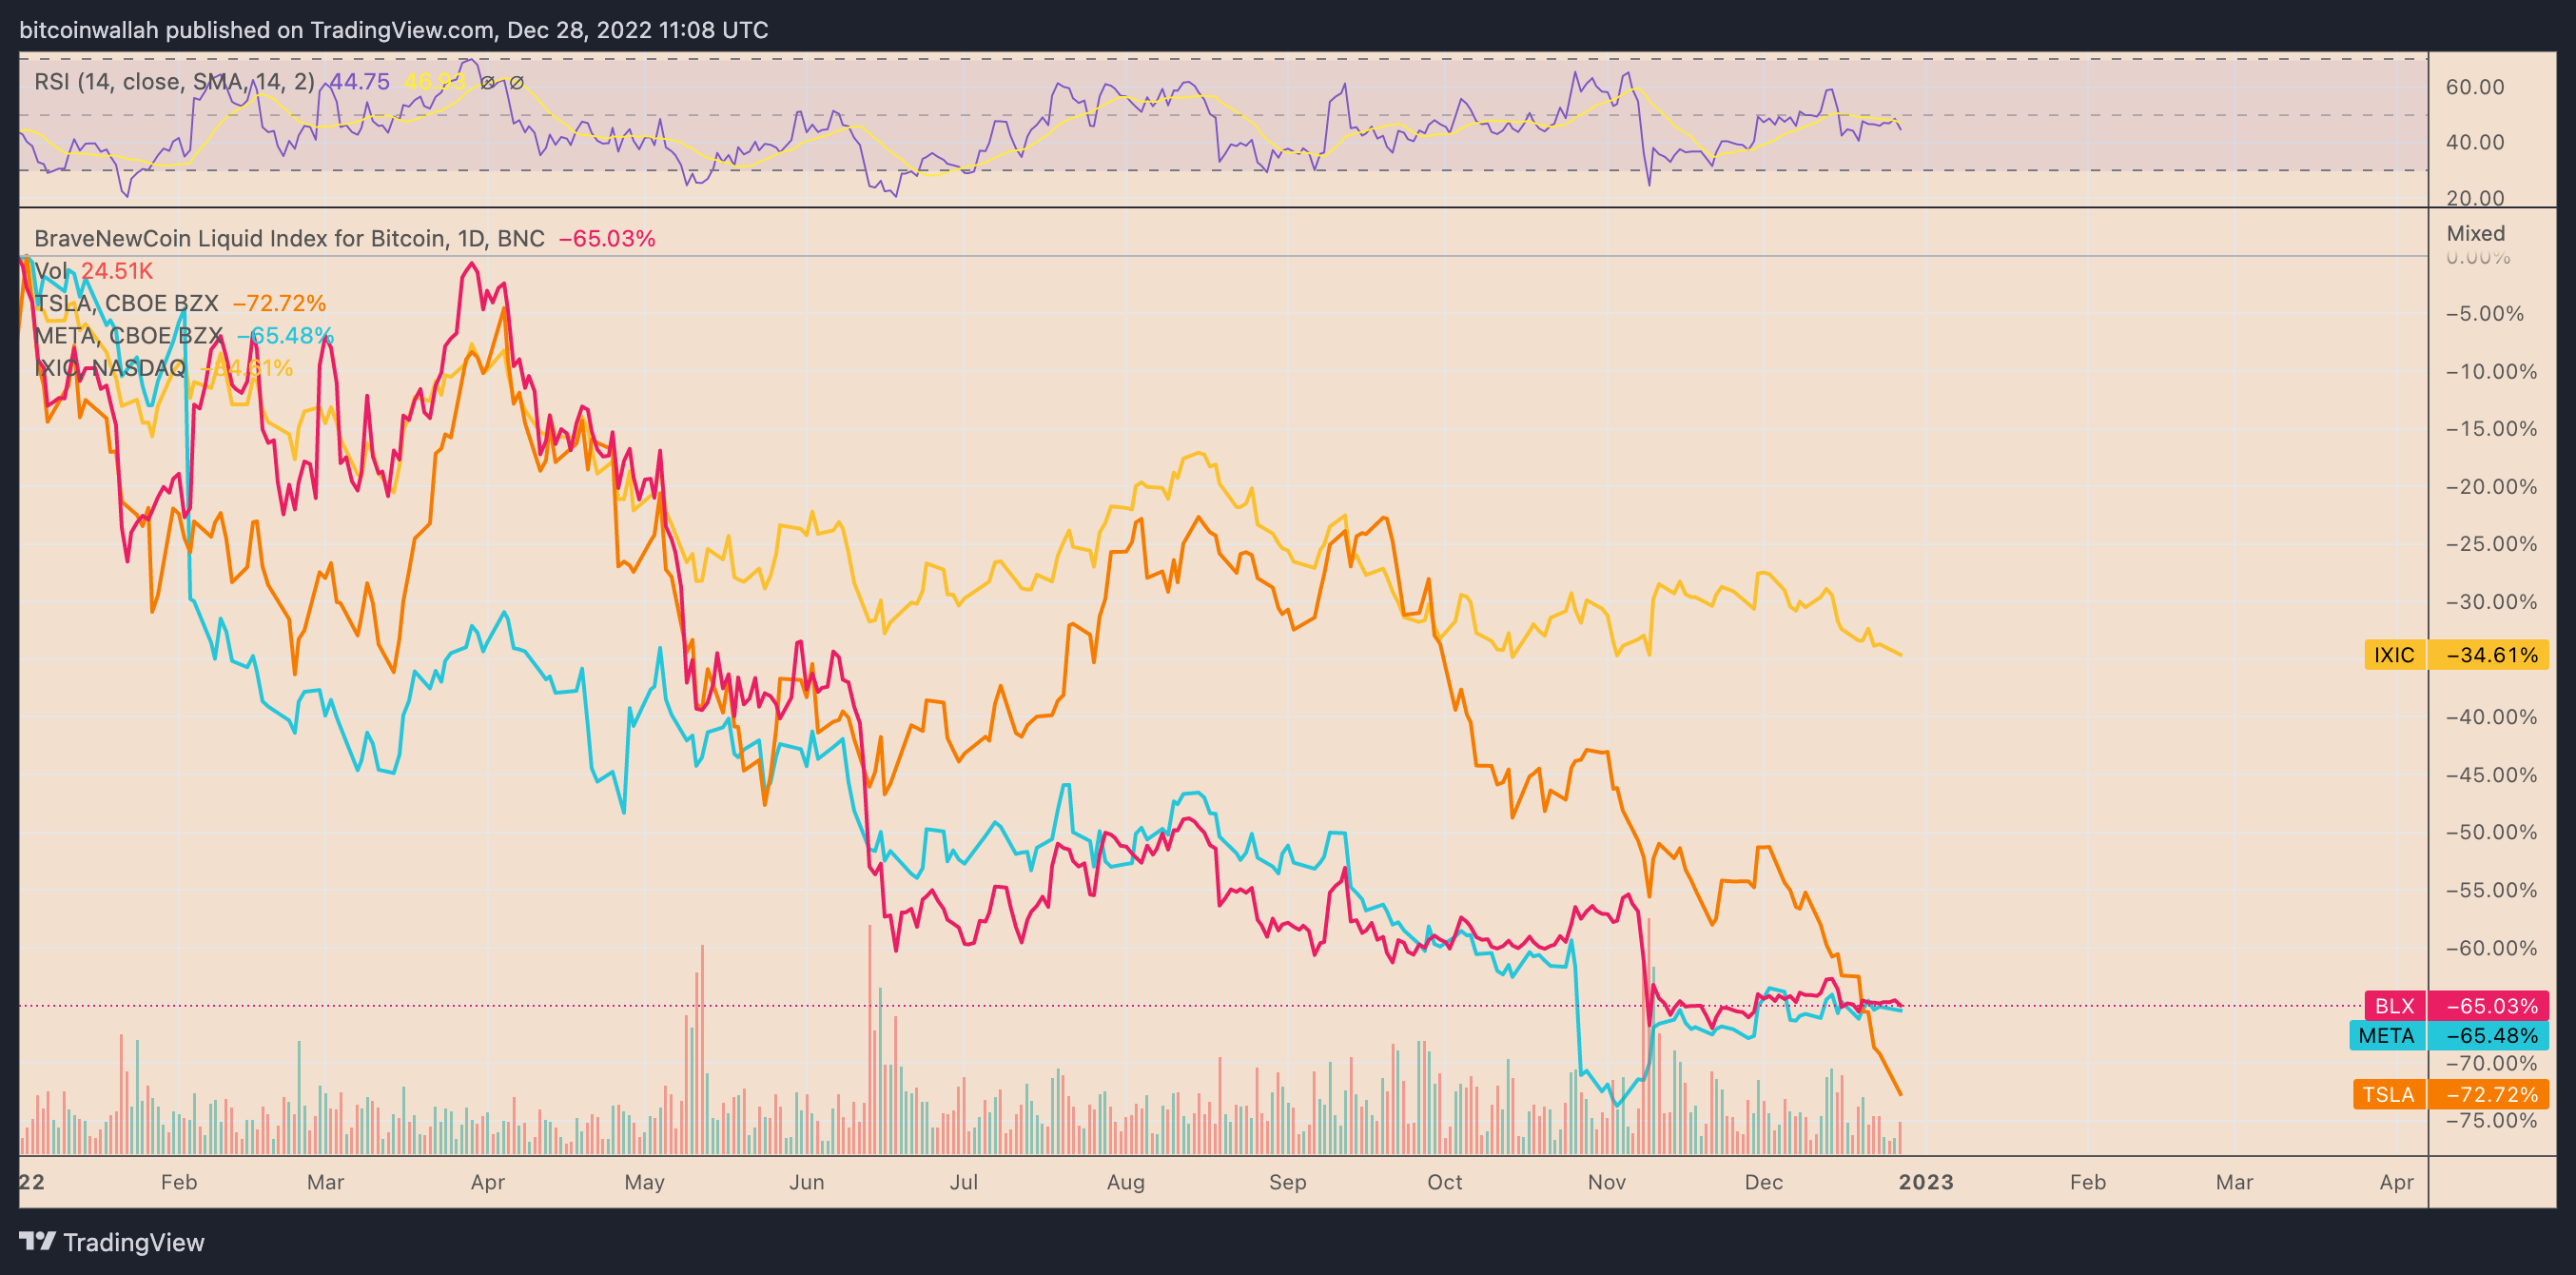
Just as with Bitcoin, the Fed’s rate hikes remains the most-critical factor behind the U.S. stock market’s underperformance. But whether a tighter monetary policy would cause an economic recession in 2023 remains to be seen.
This uncertainty has driven capital toward the U.S. dollar for safety, with the U.S. dollar index (DXY), a barometer to gauge the greenback’s health versus top foreign currencies, rising nearly 8.5% YTD.
Gold not such a “safe haven”
Spot gold is up 0.14% YTD to nearly $1,800 an ounce, which makes it a better performer than Bitcoin and the U.S. stock market.
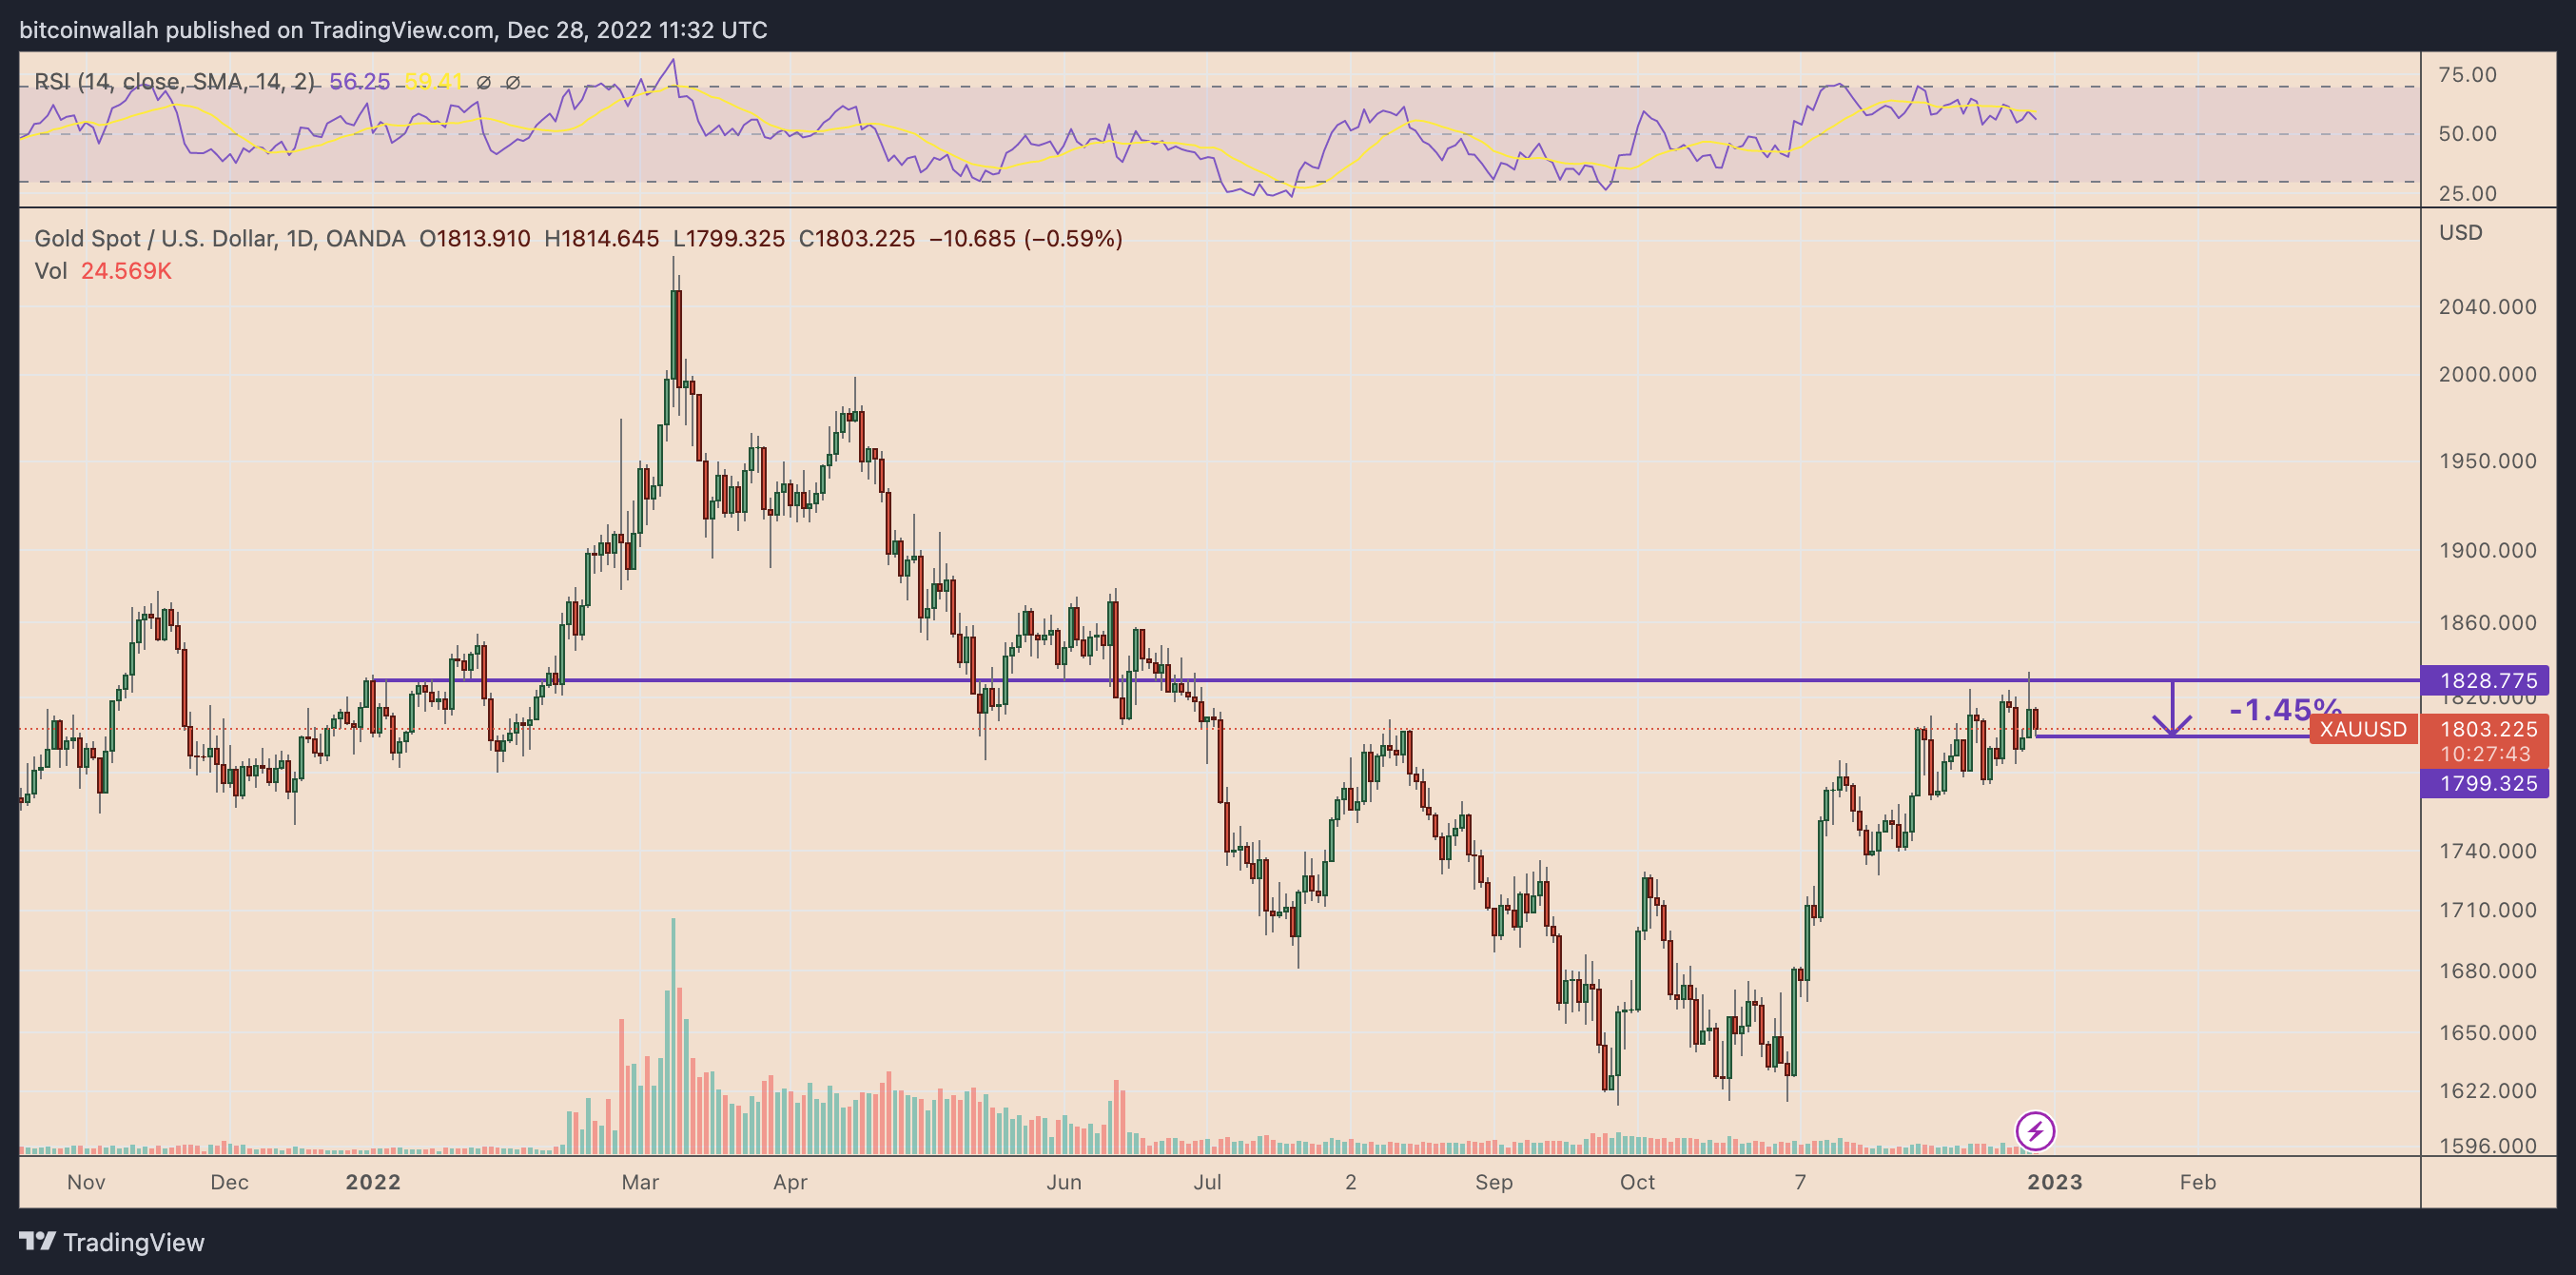
Nevertheless, the year has seen gold deviating from its “safe haven” characteristics in the face of a stronger dollar…
Click Here to Read the Full Original Article at Cointelegraph.com News…


