The Tom Demark (TD) Sequential has given a sell signal for Bitcoin after the asset broke past the $71,000 level in the past day.
Bitcoin TD Sequential Is Giving A Sell Signal Right Now
As explained by analyst Ali Martinez in a new post on X, a TD Sequential signal has appeared in the 1-hour price of Bitcoin. The “TD Sequential” refers to an indicator in technical analysis (TA) that’s generally used for locating probable points of reversal in any commodity’s price.
The TD Sequential involves two phases: setup and countdown. During the first of these, candles of the same polarity (that is, whether red or green) are counted to nine. After these nine candles are in, the asset may be assumed to have encountered a turnaround.
Related Reading
Naturally, if the candles leading up to the setup’s completion were red, the TD Sequential would give a buy signal for the asset. On the other hand, green candles would imply a potential reversal towards the downside.
After the setup is over, the countdown phase begins. This second phase of the indicator is much like the first one, except for the fact that the number of candles to be counted here is thirteen rather than nine. The countdown’s completion implies that the price has encountered another likely point of reversal.
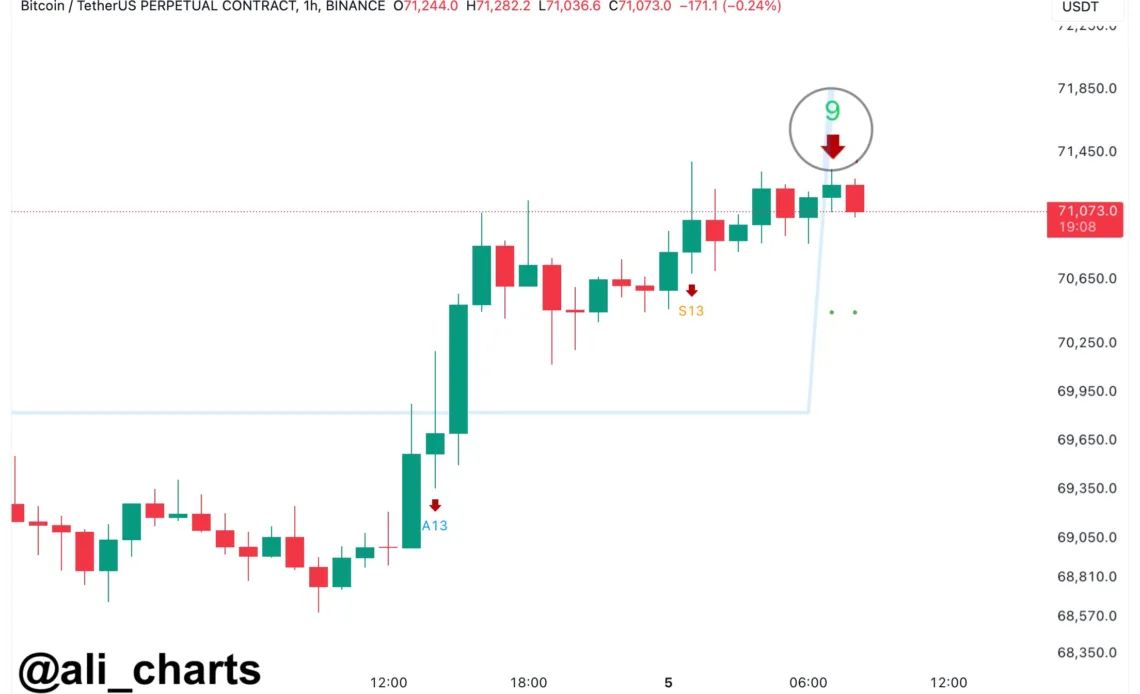
A TD Sequential phase of the former type has recently been completed in the 1-hour price of Bitcoin. Below is the chart shared by Ali that shows this pattern in cryptocurrency.
From the graph, it’s visible that TD Sequential has recently finished its setup phase with green candles for Bitcoin. This signal comes as the coin has surged beyond the $71,000 level for the first time since mid-May.
This TD setup would mean that the party could already be over for now as the coin may have reached a local top, and a reversal to the down direction could be coming.
While the TD Sequential could spell a worry for BTC in the short-term, another TA indicator could point towards a bullish outcome for the asset instead. As CryptoQuant author Axel Adler Jr has pointed out in an X post, the Bitcoin Relative Strength Index (RSI) is at a level where recent uptrends have begun.
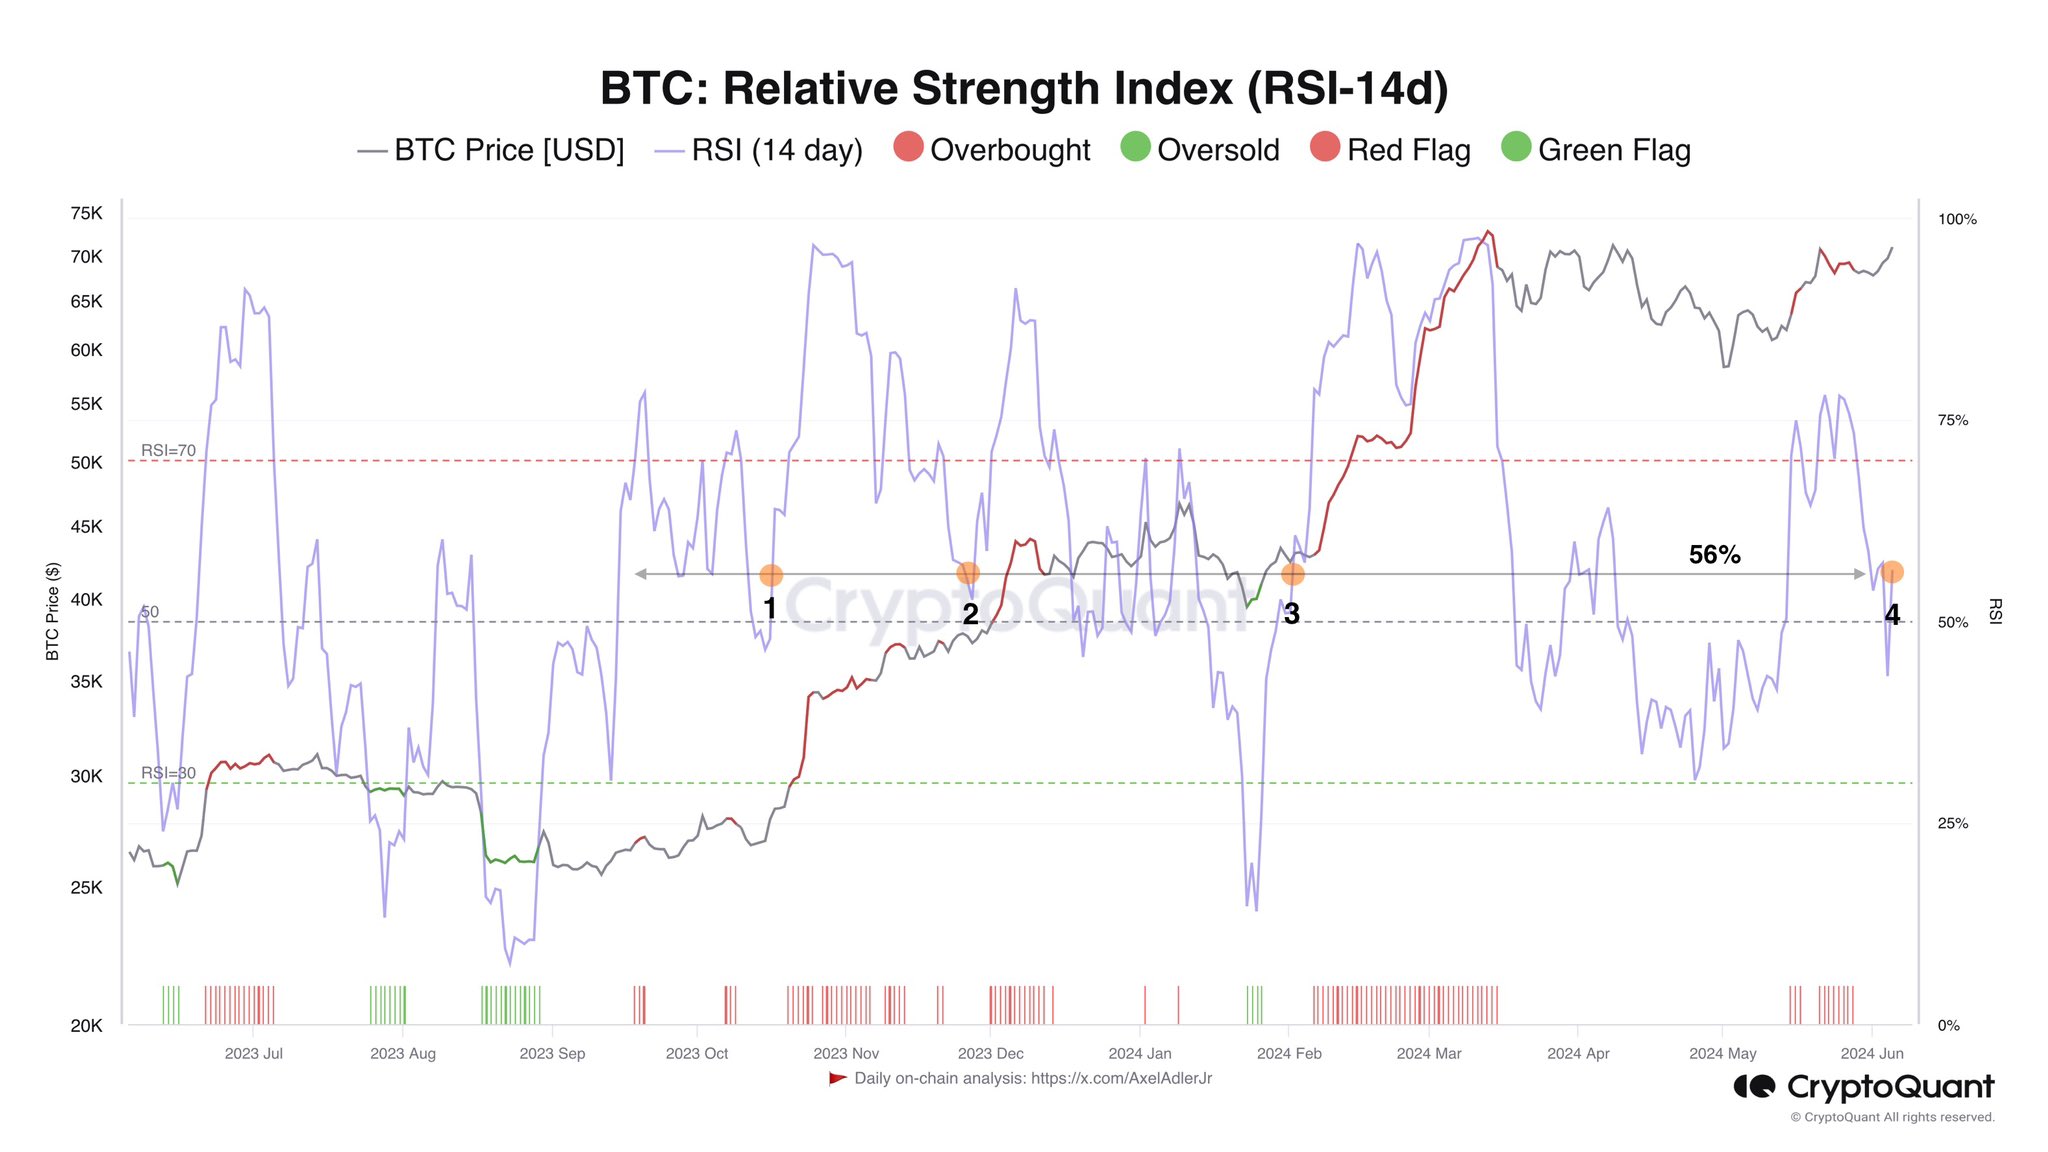
The RSI tracks the magnitude of recent changes in the price of any given asset. As the chart shows, the 14-day RSI…
Click Here to Read the Full Original Article at NewsBTC…


