Bitcoin (BTC) rose above $38,000 on Nov. 24, but the bulls could not build upon this strength. This suggests hesitation to buy at higher levels. Bitcoin is on track to form a Doji candlestick pattern on the weekly chart for the second consecutive week. This signals indecision among the bulls and the bears about the next directional move.
With Bitcoin maintaining near its 18-month high, BitMEX co-founder Arthur Hayes retained his bullish stance. In a X (formerly Twitter) post, Hayes said that the United States dollar liquidity was increasing, which is likely to push Bitcoin higher.
Another bullish projection came from PlanB, creator of the stock-to-flow family of BTC price models, who said in a post on X that Bitcoin may not stay at the current levels for long. PlanB expects Bitcoin to maintain an average price of at least $100,000 between 2024 and 2028.
Analysts have turned increasingly bullish in the past few days, but traders should exercise caution because every uptrend is bound to have corrections.
Could Bitcoin soar above $38,000 or start a corrective phase? Let’s look at the charts of the top 5 cryptocurrencies that may outperform in the near term.
Bitcoin price analysis
Bitcoin’s march higher has hit a wall near $37,980 but the bulls are not hurrying to close their positions. This shows that traders expect the uptrend to progress further.
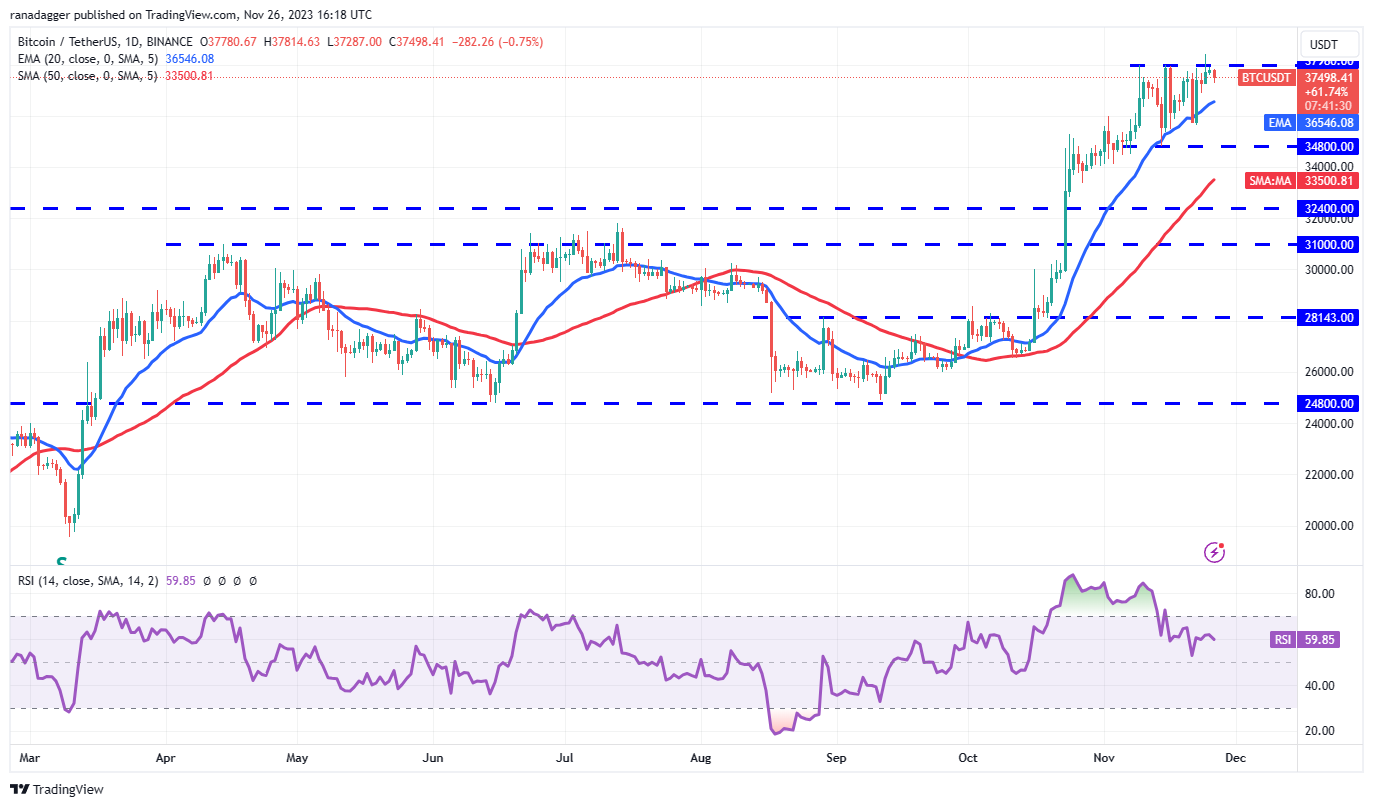
The immediate support on the downside is the 20-day exponential moving average ($36,546). If the price snaps back from this support, it will signal that every minor dip is being purchased. That will increase the possibility of a break above $37,980.
If that happens, the BTC/USDT pair could rally to $40,000. This level may pose a strong hurdle to the bulls, but if buyers flip the $38,000 level into support on the downside, the rally could stretch to $48,000.
Conversely, if the price plummets below the 20-day EMA, it will indicate that traders are booking profits. The pair may then dump to $34,800.
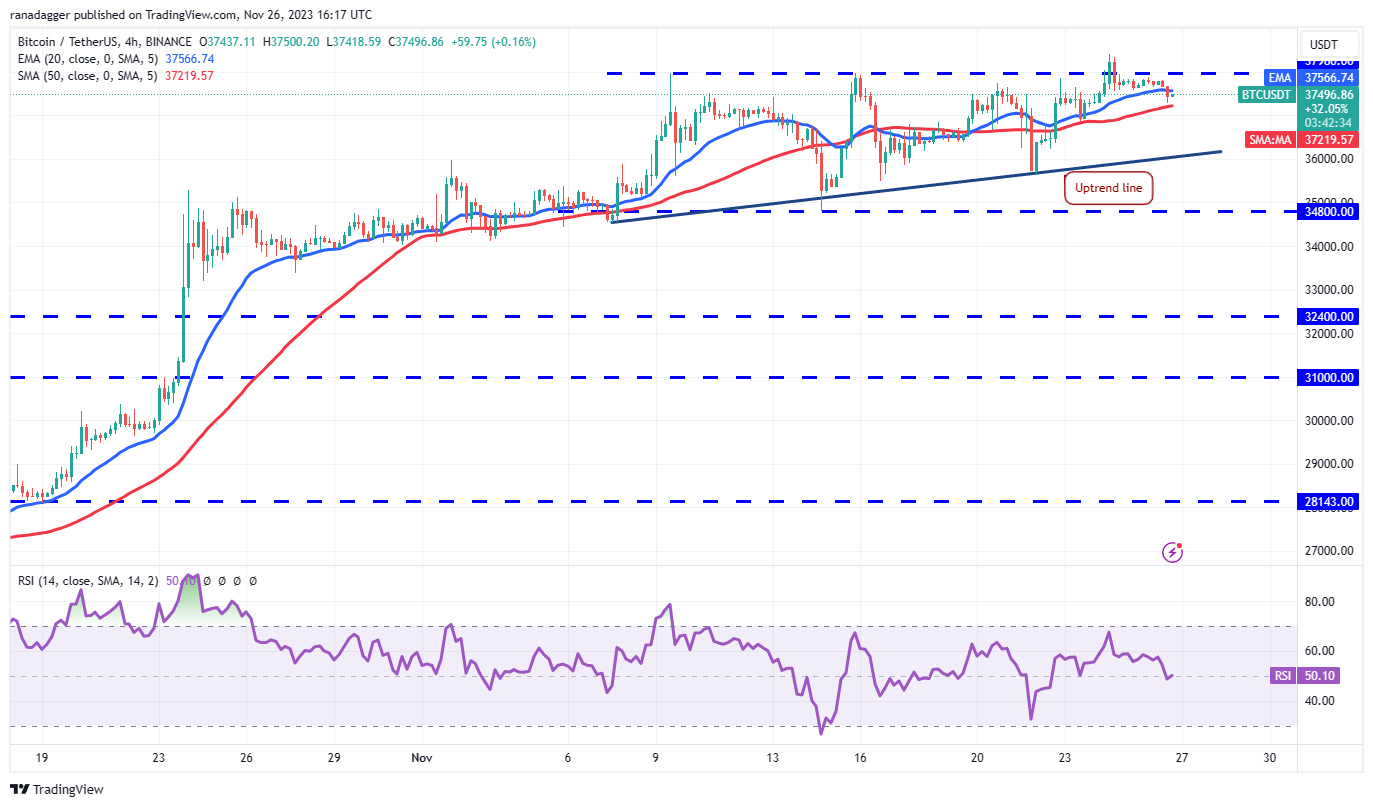
The bulls are trying to maintain the price above the moving averages but are finding it difficult to overcome the obstacle at $37,980. The relative strength index (RSI) is just above the midpoint, indicating that the bullish momentum is weakening.
If the price slips below the 50-simple moving average, the pair may plunge to the uptrend line. The bulls are expected to defend this level with vigor….
Click Here to Read the Full Original Article at Cointelegraph.com News…


