The co-founders of the crypto analytics firm Glassnode think Bitcoin (BTC) could be primed for a parabolic rise if the top digital asset repeats a particular pattern.
Glassnode co-founders Jan Happel and Yann Allemann, who share the Negentropic handle on the social media platform X, draw attention to the quote “History doesn’t repeat itself, but it often rhymes,” which is often attributed to Mark Twain.
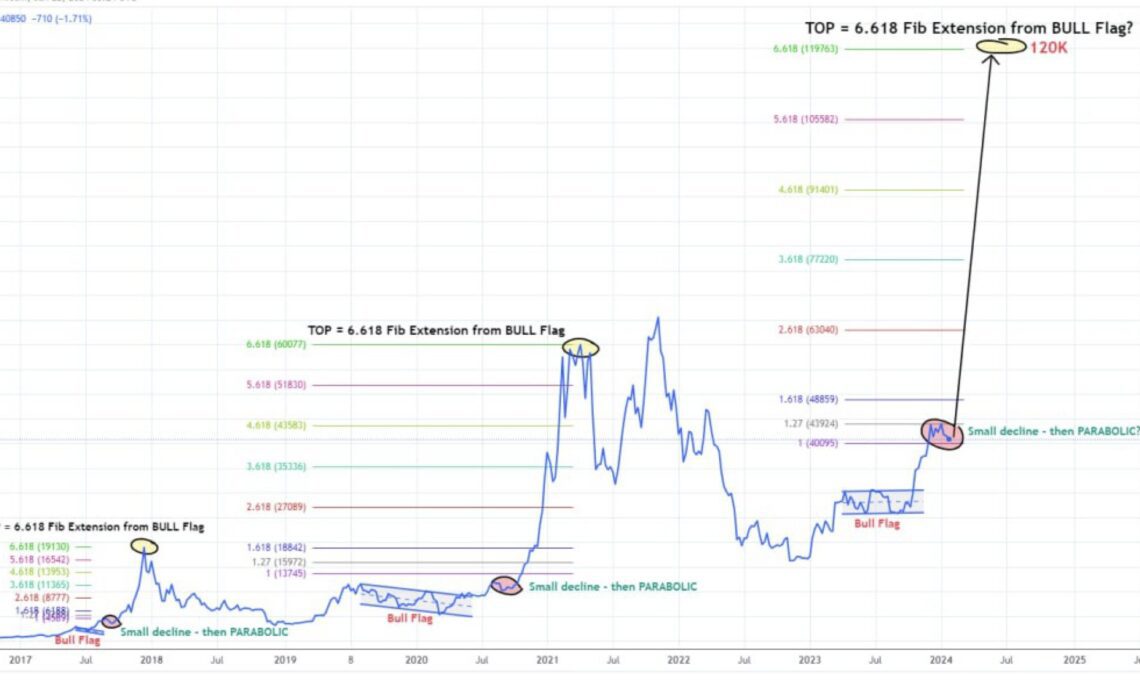
According to Happel and Allemann, Bitcoin looks poised to replicate a pattern witnessed during the last two bull markets as BTC creates a bull flag in the weekly chart.
“BTC has moved to the 6.618 Fibonacci extension after a bull flag correction. We are currently in a small correction like in late 2017 and late 2020.
Will history rhyme in 2024 – and BTC move to its 6.618 Fib extension in this bull market? That would give us a target of ~$120,000. Time will tell!”
Traders use Fibonacci extensions in technical analysis to estimate profit targets and price pullbacks. They are based on Fibonacci ratios.
Bitcoin is trading at $40,021 at time of writing. The top-ranked crypto asset by market cap is down about 3% in the past 24 hours.
The Glassnode co-founders also appear bullish on equities.
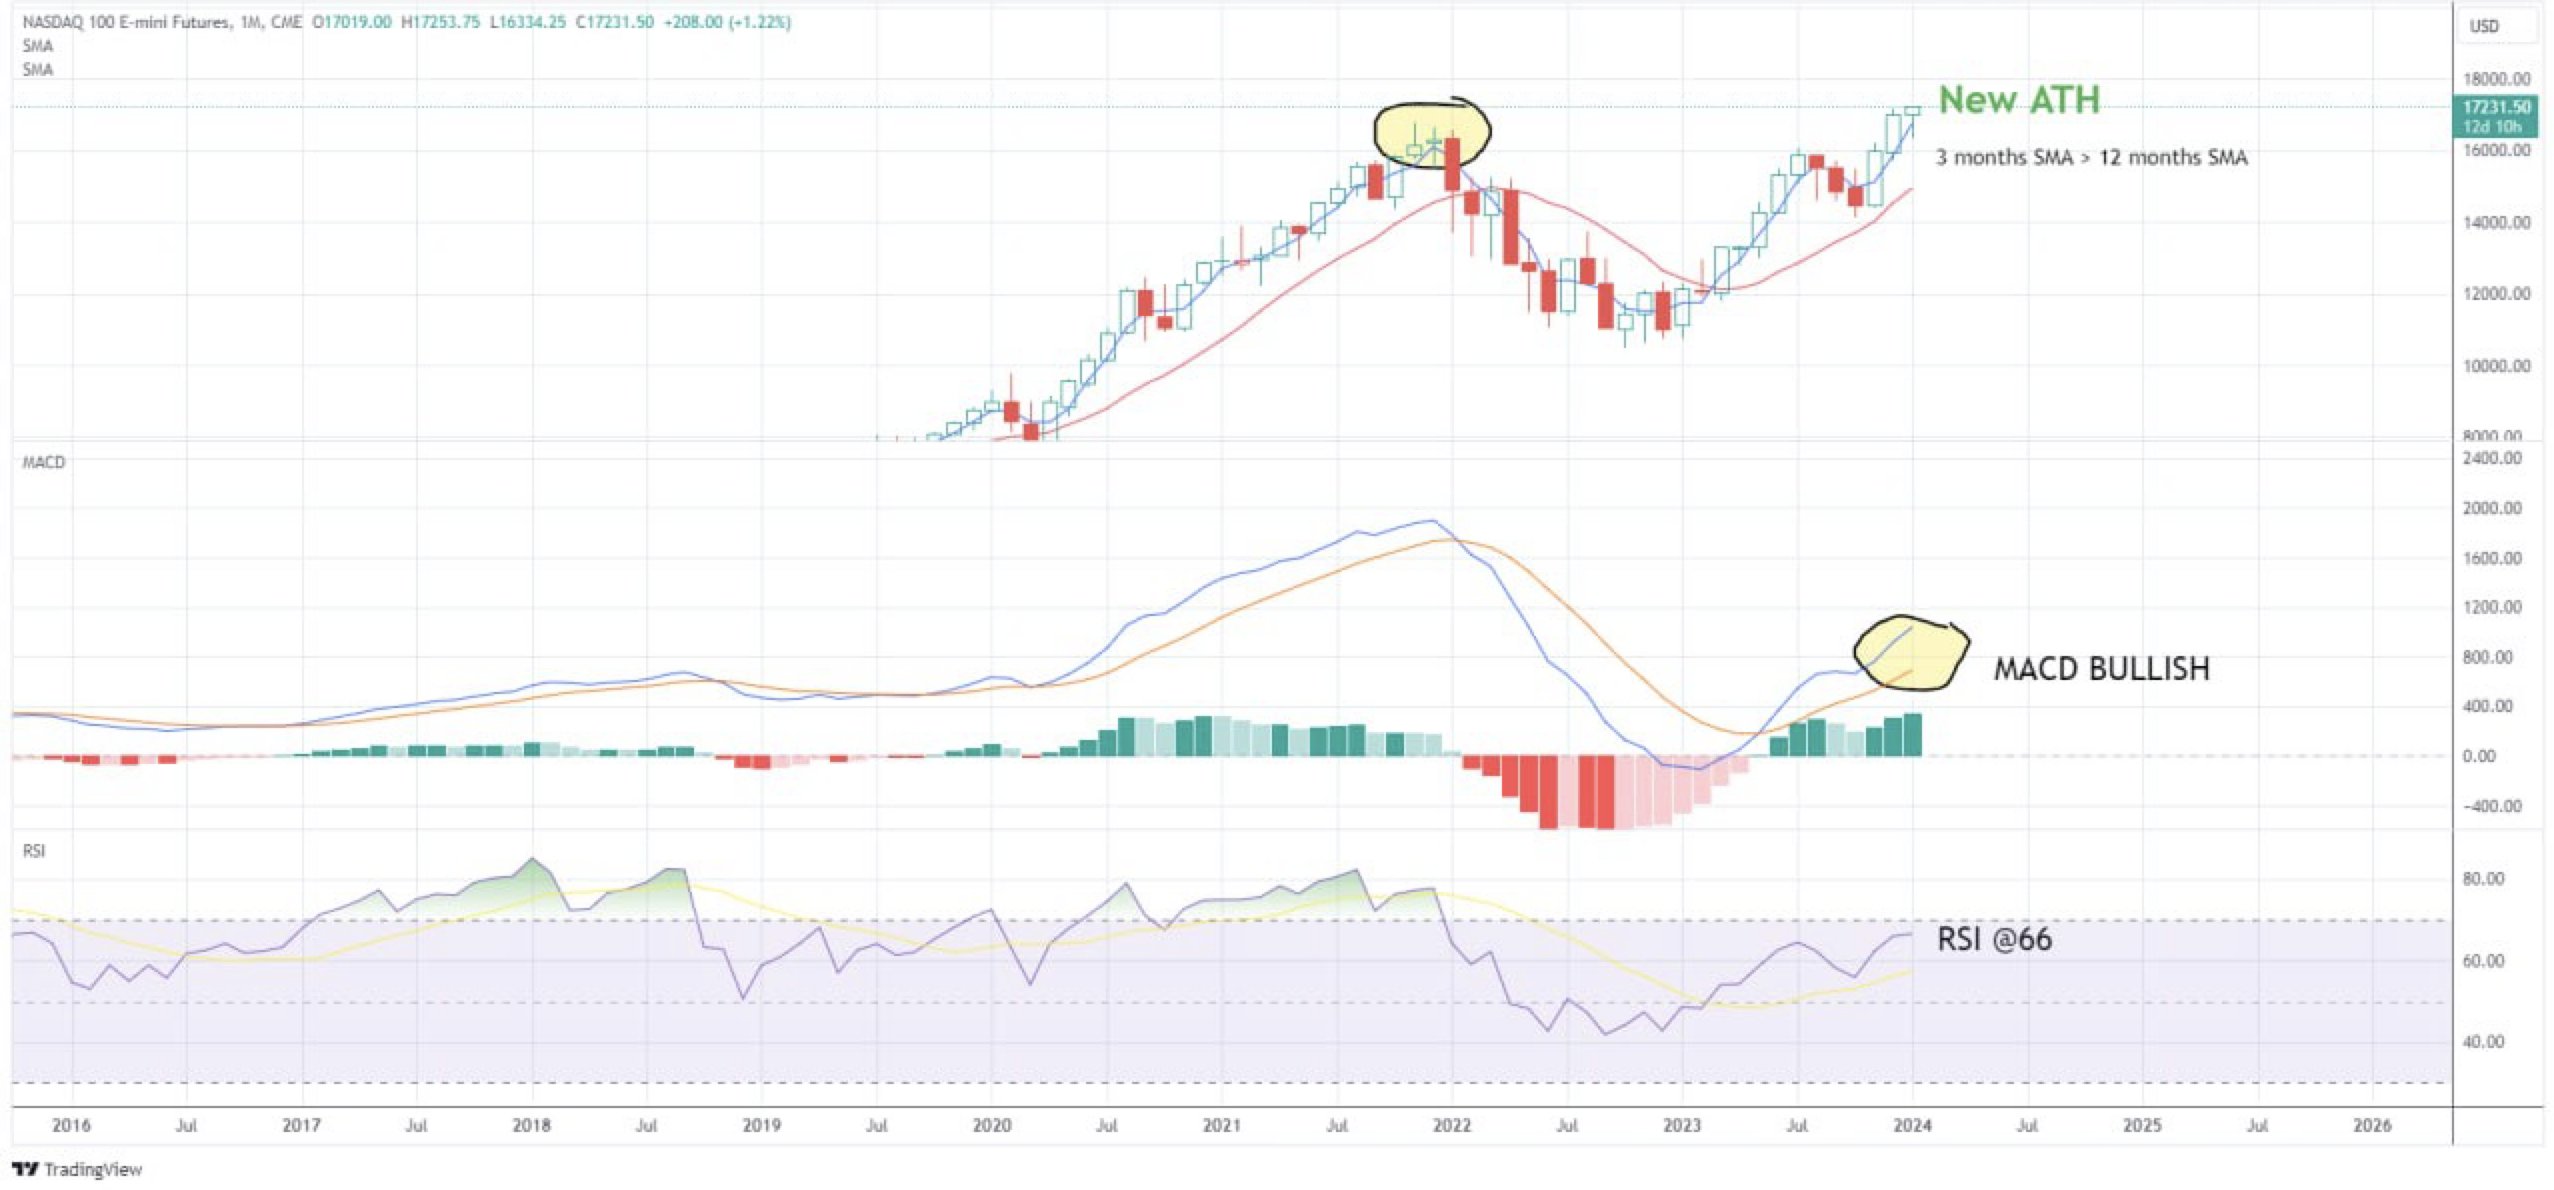
“Trend following is a strong investment strategy! Ask yourself: ‘Why am I bearish equities in current technical setup?’ Nasdaq has just surpassed former all-time highs. It is above its three-month SMA [simple moving average] and its 12-month SMA. And [its] three-month SMA is above [its] 12-month SMA.
RSI (Relative Strength Index) is at 66 (= strong momentum). MACD (moving average convergence divergence) is bullish and rising. From a trend-following perspective…. why would I expect a crash here?”

The RSI measures the price momentum of an asset on a scale of 0 to 100. A level of 30 and below indicates oversold conditions, while a reading of 70 and above suggests overbought conditions.
Meanwhile, the MACD is traditionally used to spot trend reversals and confirm trends.
Don’t Miss a Beat – Subscribe to get email alerts delivered directly to your inbox
Check Price Action
Follow us on Twitter, Facebook and Telegram
Surf The Daily Hodl Mix
 

Disclaimer: Opinions expressed at The Daily Hodl are not investment advice. Investors should do their due diligence before making any high-risk investments in Bitcoin, cryptocurrency or digital assets. Please be advised that your transfers…
Click Here to Read the Full Original Article at Bitcoin News – The Daily Hodl…


