Following the failure to break above the $72,983 resistance level, the price of Bitcoin has continued to drop. Although Bitcoin’s price is still trading above the 1-day Simple Moving Average (SMA), this rejection has led to the crypto asset dropping from $71,942 to $66,785 and moving below the SMA both in the 1-hour and the 4-hour chart. This drop below the SMA could trigger a change of character and the price will go bearish.
As of the time of writing the price of Bitcoin was trading at around $67,635 and was up by 0.14% with a market capitalization of over $1.3 trillion and a 24-hour trading volume of over $25 billion. Its market capitalization and trading volume are both down by 1.14% and 6.07% respectively in the last 24 hours.
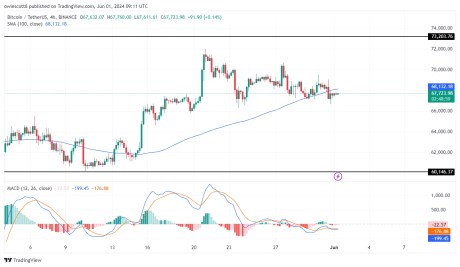
Bitcoin Price Conditions In 4-Hour And 1-Day Chart
From the 4-hour timeframe, BTC has dropped below the simple moving average. This indicates that the price of BTC might begin to move downward from this point.
The 1-hour MACD also indicates that BTC could go bearish as the MACD histograms are trending below the zero line. Also, the MACD line and the signal have crossed each other trending below the MACD zero line.
From the 1-day chart, it can be observed that BTC‘s price is moving toward the 100-day simple moving average. The 1-day MACD also creates a formation suggesting that Bitcoin’s price might go bearish, as the histograms are already trending below the MACD zero line.
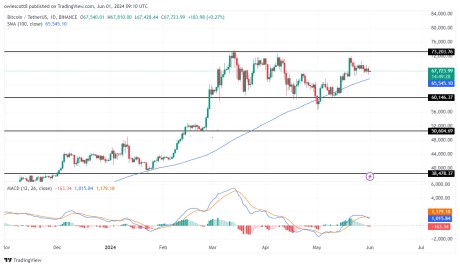
The MACD line and the MACD signal line have crossed each other and are heading toward the MACD zero line. Examining the price formations and that of MACD from both timeframes, BTC could make a huge drop and probably start a bearish trend.
A Path To New All-Time High On The Horizon?
Currently, there is one major resistance level $73,203, and two major support levels $60,146 and $50,604. If the price of Bitcoin goes bearish as predicted, it will start to move downward toward the $60,146 support level.
Should it break below this level, it could move further to test the $50,604 support level. Also, there are other support levels below $67,635, which BTC could move on to test if there is a break below the $60,146 and $50,604 support levels.
However, given that the digital asset fails to break below any of the support levels mentioned above, it will begin to move upward toward its previous resistance level of $73,203. Meanwhile, if it breaks above this level, it might start a new rally possibly to create a new high.

Click Here to Read the Full Original Article at NewsBTC…


