Bitcoin price has been moving within a restricted range for over a week now. The coin had attempted to move north over the past few days. However, it has not managed to trade near the $20,000 mark.
The movement of the Bitcoin price has mainly remained sandwiched between $18,000 and $20,000, respectively.
Over the last 24 hours, BTC slipped by 0.4%, confirming that there has not been significant price movement.
In the past week, BTC depreciated by 1.1%. Overall market strength has been choppy, which is why market movers have remained dull on their respective price charts.
The technical outlook of Bitcoin continued to side with the bears. Buying strength has remained low as a result of a slowdown in demand for Bitcoin.
According to its one-day chart, over the next trading sessions, Bitcoin is set to retrace further and trade close to the $18,900 price mark.
This support level marks a crucial price level for the coin as it will determine the next move of Bitcoin depending on the demand for the coin.
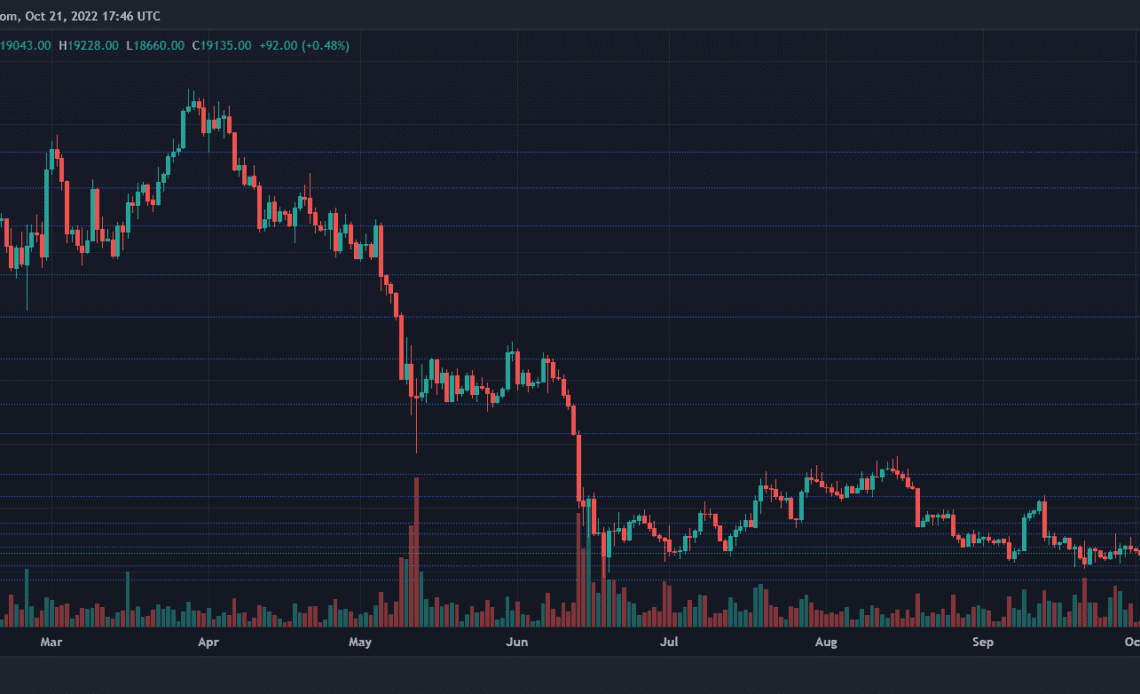
Bitcoin Price Analysis: One-Day Chart
BTC was trading at $19,100 at the time of writing. The cryptocurrency has moved up and down within the range of $19,400 and $19,000.
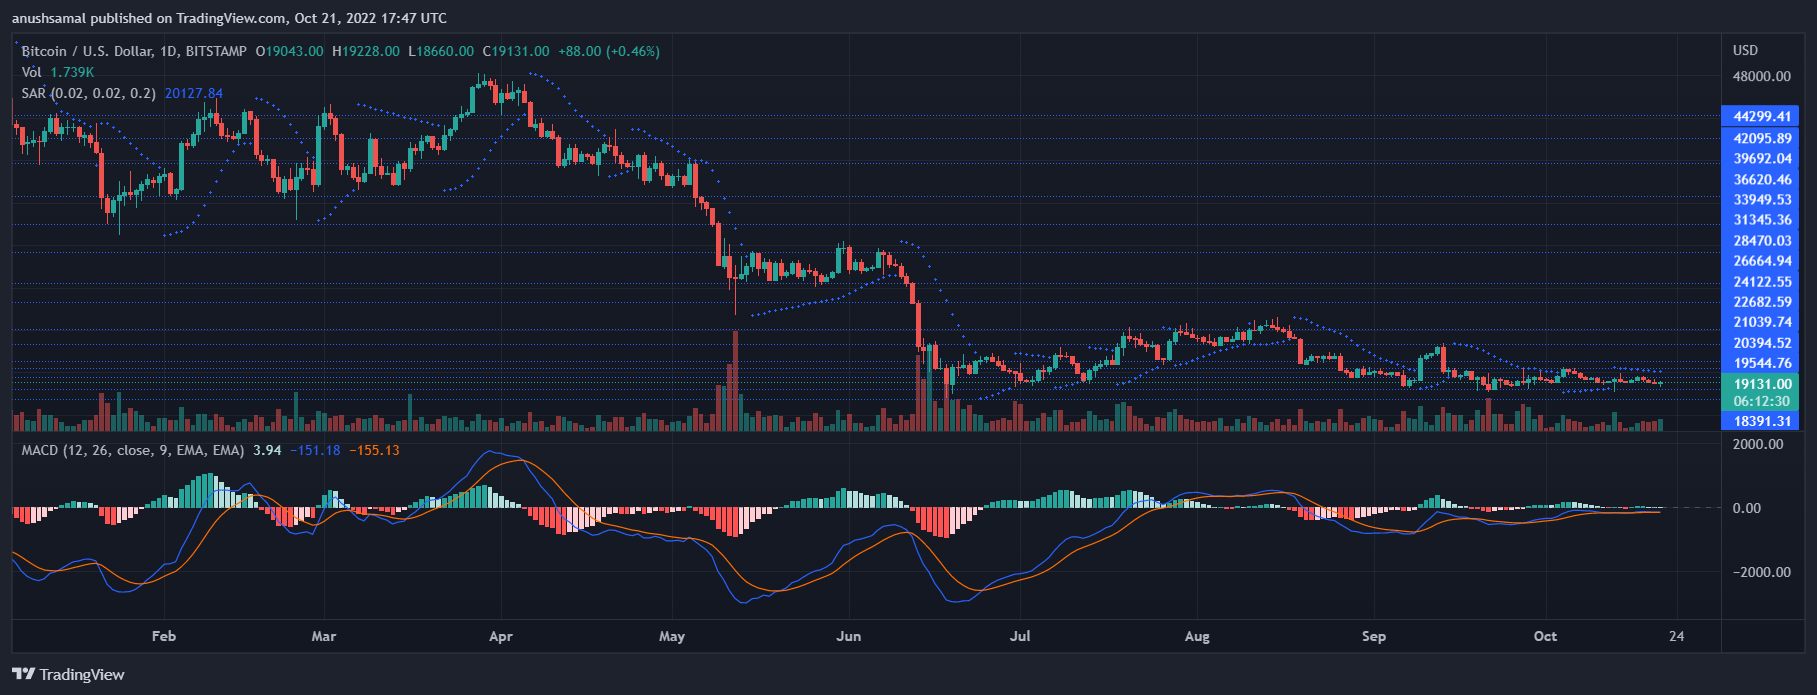
Continual movement in a similar pattern will strengthen the bears even further. Overhead resistance for the coin was at $19,600, moving past which BTC will again have a tough time crossing past $20,000.
The bulls will only take over from the $20,000 price mark. On the other hand, the nearest support would be $18,900. This is a crucial support line for the coin.
A fall from there will cause BTC to move to $18,300 and then to $17,400. The amount of Bitcoin traded in the last session turned green, which could indicate a small rise in buyers.
Technical Analysis
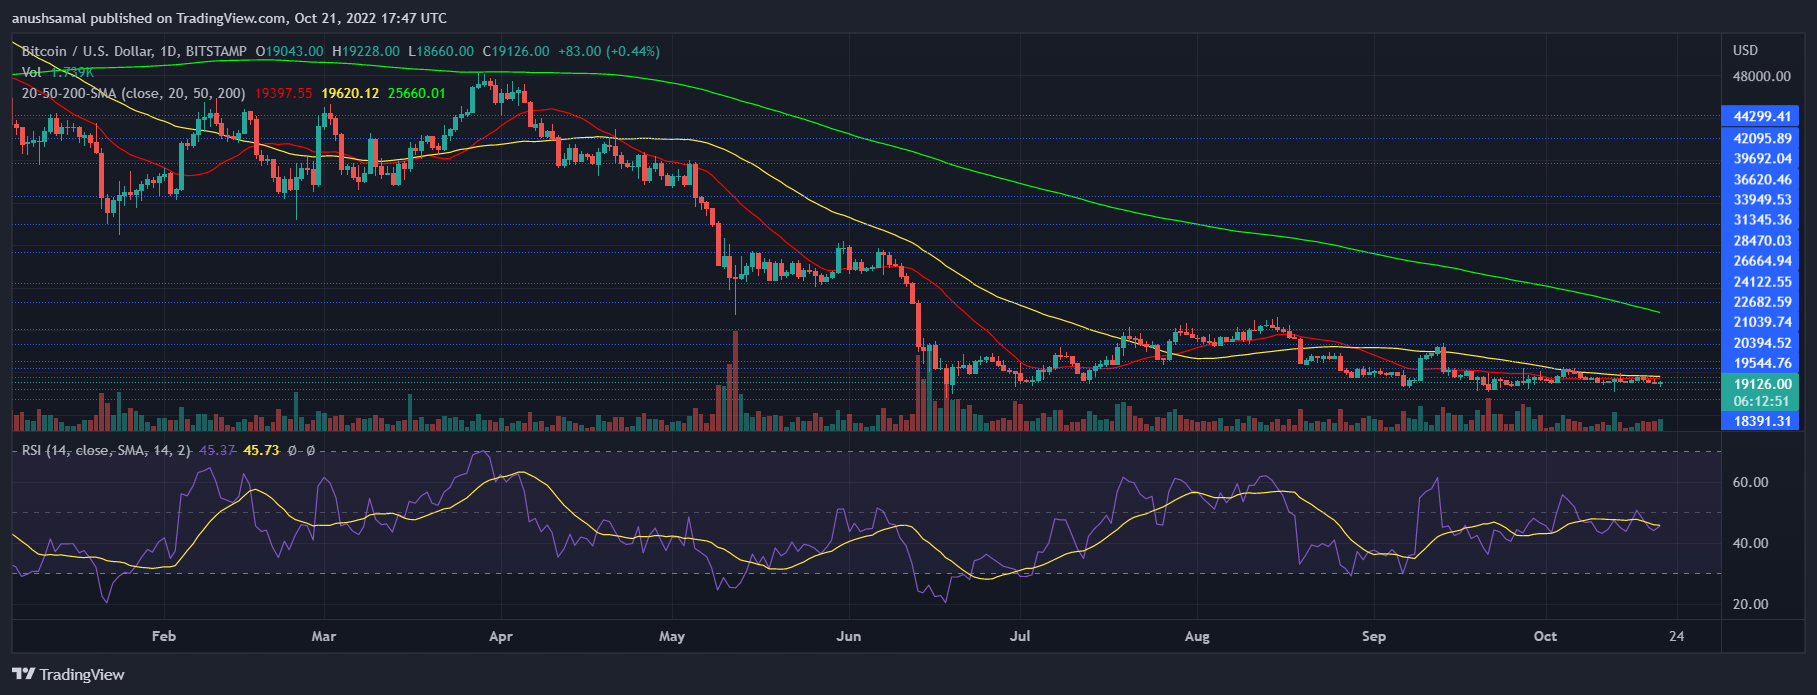
Demand for the coin has seen a slight increase over the last 24 hours. For most of this month, Bitcoin’s demand has remained low, and sellers have taken over the market.
The Relative Strength Index was below the half-line, and that meant a lower number of buyers as compared to sellers on the one-day chart.
Bitcoin price was below the 20-SMA line, which also was in accordance with fewer buyers as sellers were driving the price momentum in the market.
Click Here to Read the Full Original Article at NewsBTC…


