Bitcoin (BTC) could undergo a massive price recovery in the coming months, based on an indicator that marked the 2015 and 2018 bear market bottoms.
What’s the Bitcoin Pi Cycle bottom indicator?
Dubbed “Pi Cycle bottom,” the indicator comprises a 471-day simple moving average (SMA) and a 150-period exponential moving average (EMA). Furthermore, the 471-day SMA is multiplied by 0.745; the outcome is pitted against the 150-day EMA to predict the underlying market’s bottom.
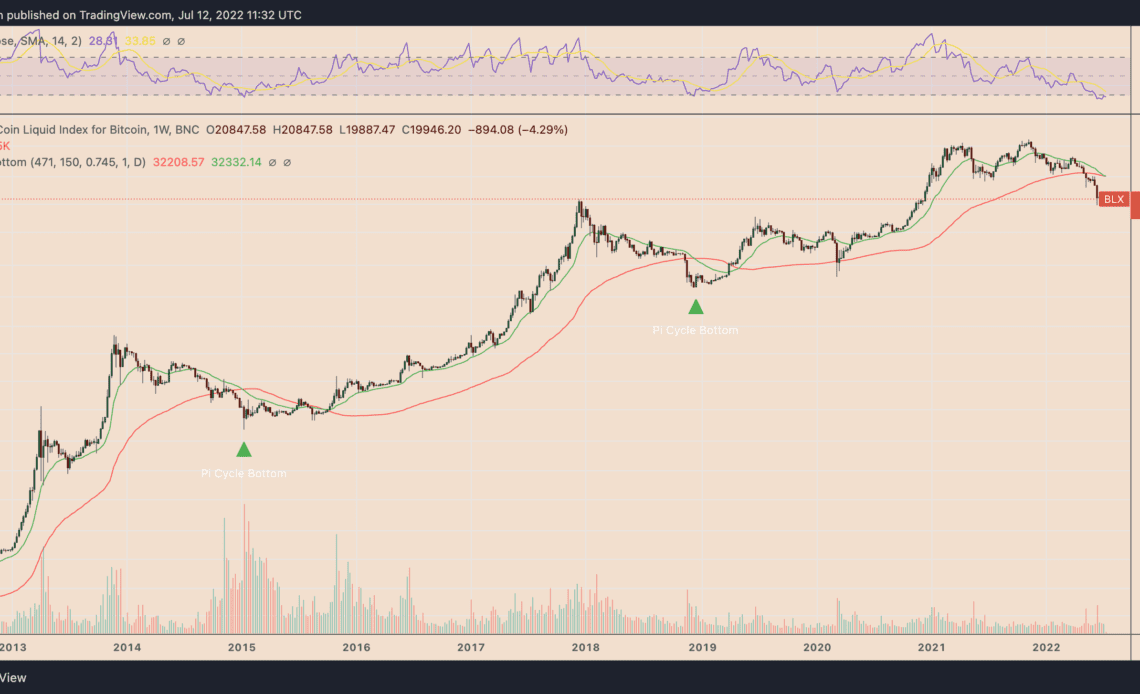
Notably, each time the 150-period EMA has fallen below the 471-period SMA, it has marked the end of a Bitcoin bear market.
For instance, in 2015, the crossover coincided with Bitcoin bottoming out near $160 in January 2015, followed by an almost 12,000% bull run toward $20,000 in December 2017.
Similarly, the second 150-471 MA crossover in history marked the end of the 2018 bear cycle. It also followed a 2,000% price rally — from nearly $3,200 in December 2018 to $69,000 in November 2021.
Only the third time in history
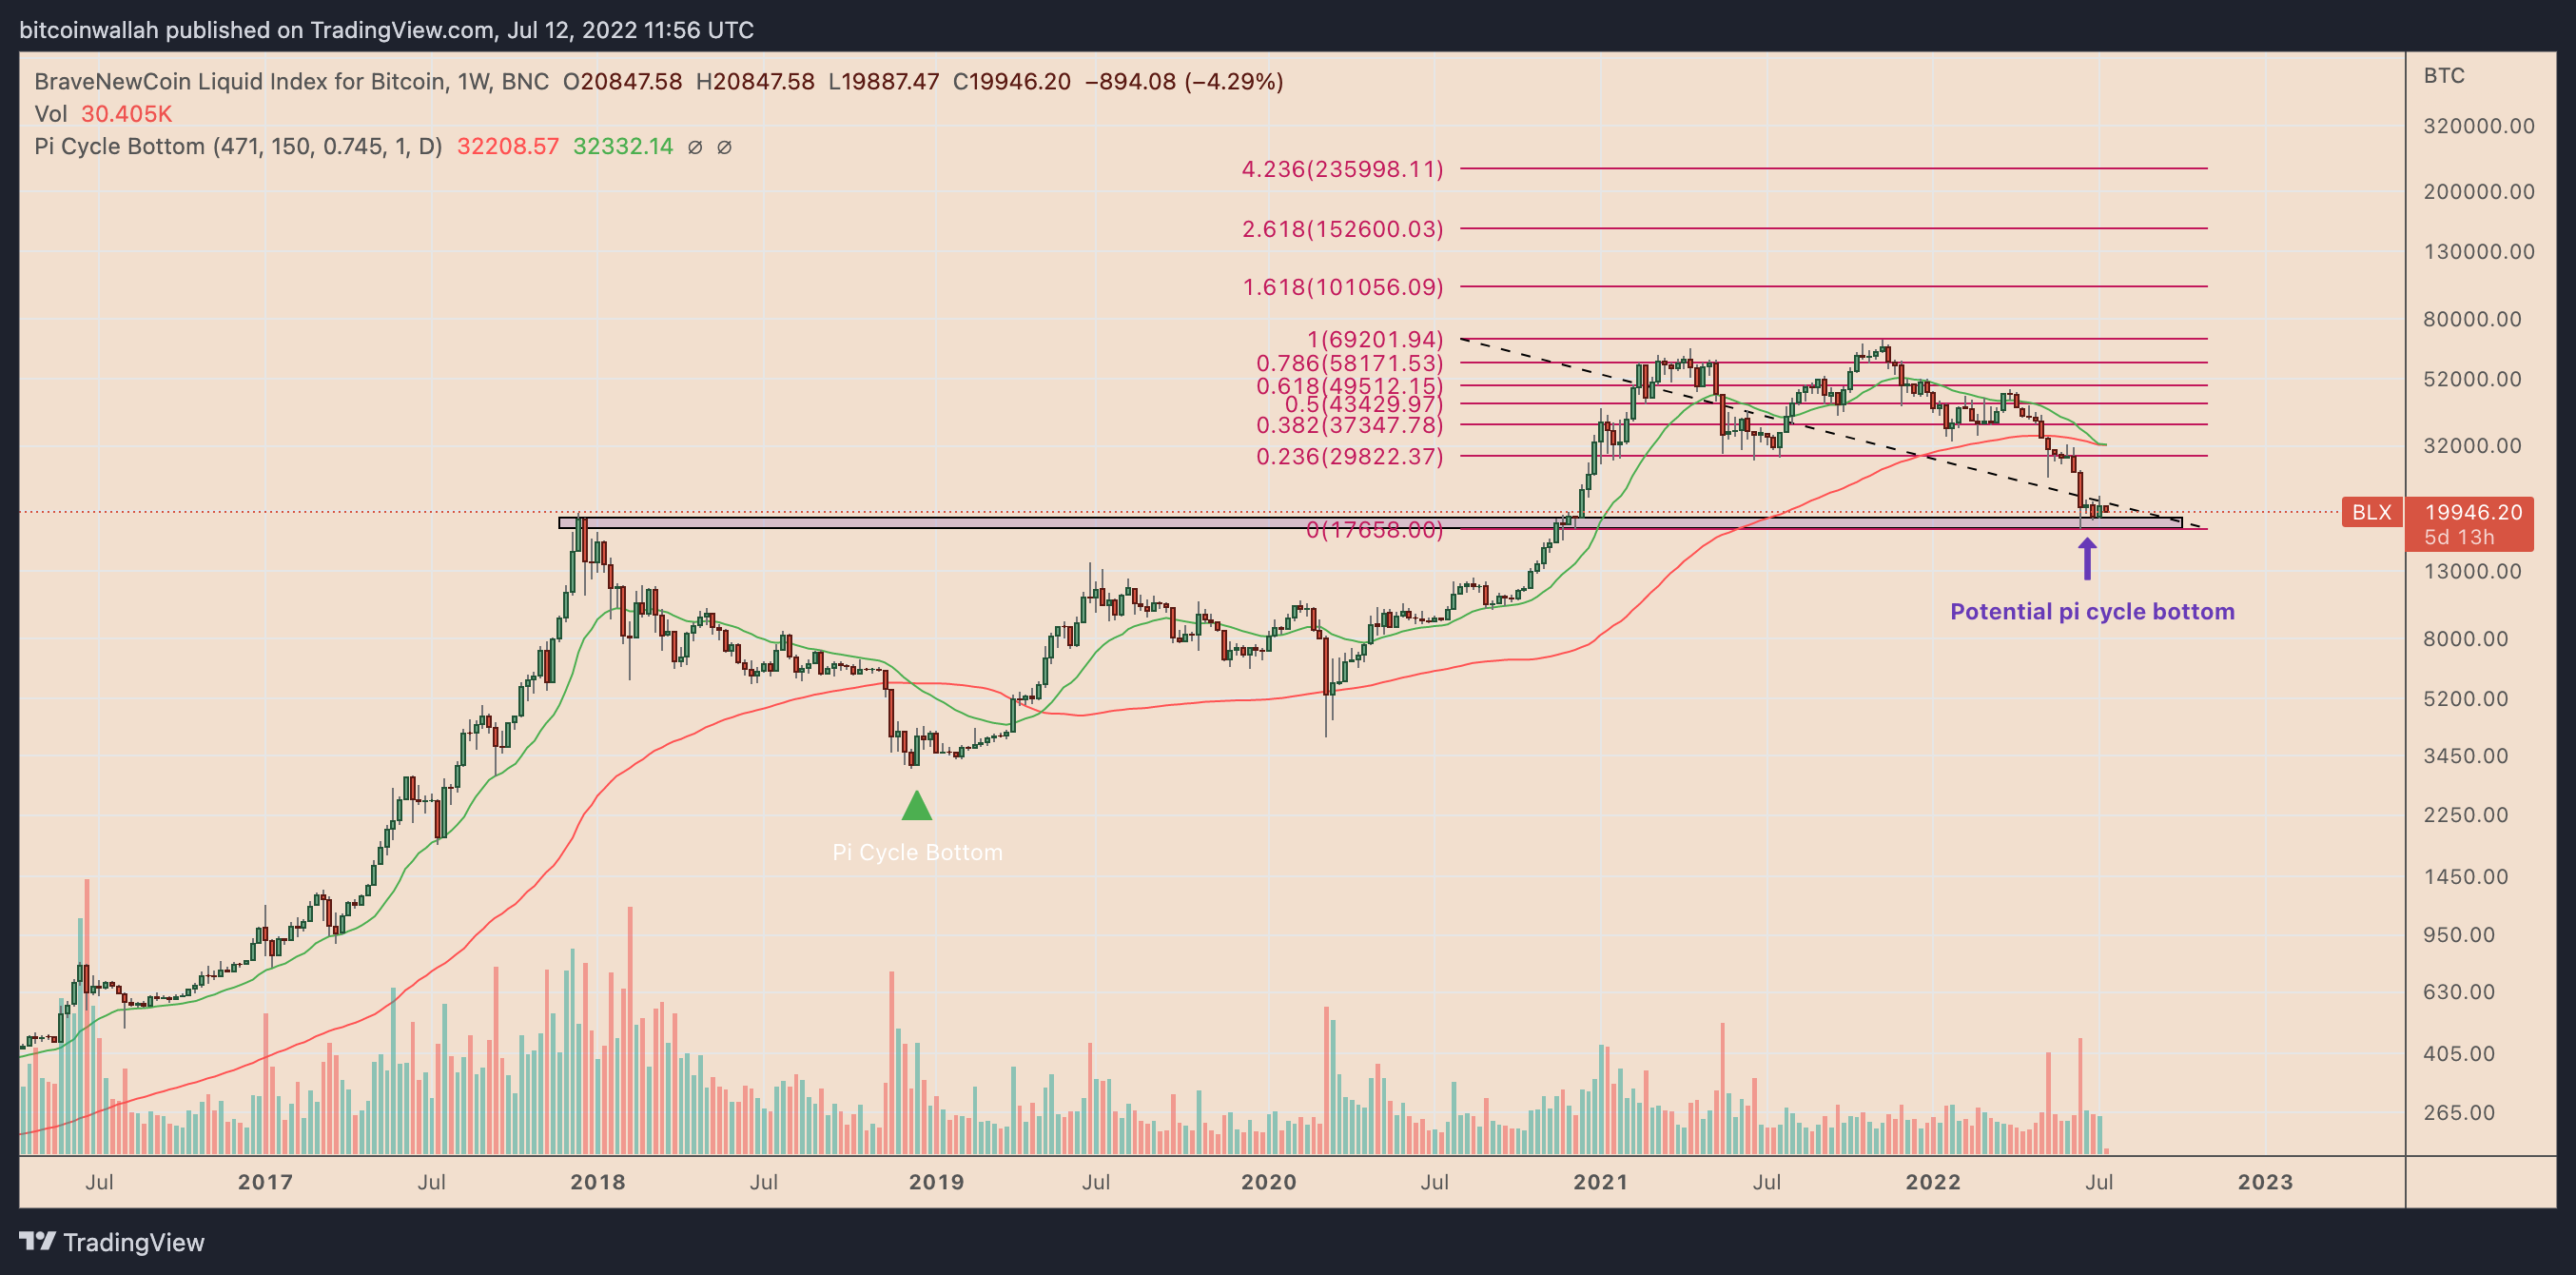
This week, Bitcoin’s 150-day EMA (at $32,332 as of July 12) is set to close below its 471-day EMA (at $32,208), thus logging the third Pi Cycle bottom in its history.

The crossover appears as Bitcoin wobbles around $20,000, after a 75%-plus price correction from its peak level of $69,000.
Related: Bitcoin price may bottom at $15.5K if it retests this lifetime historical support level
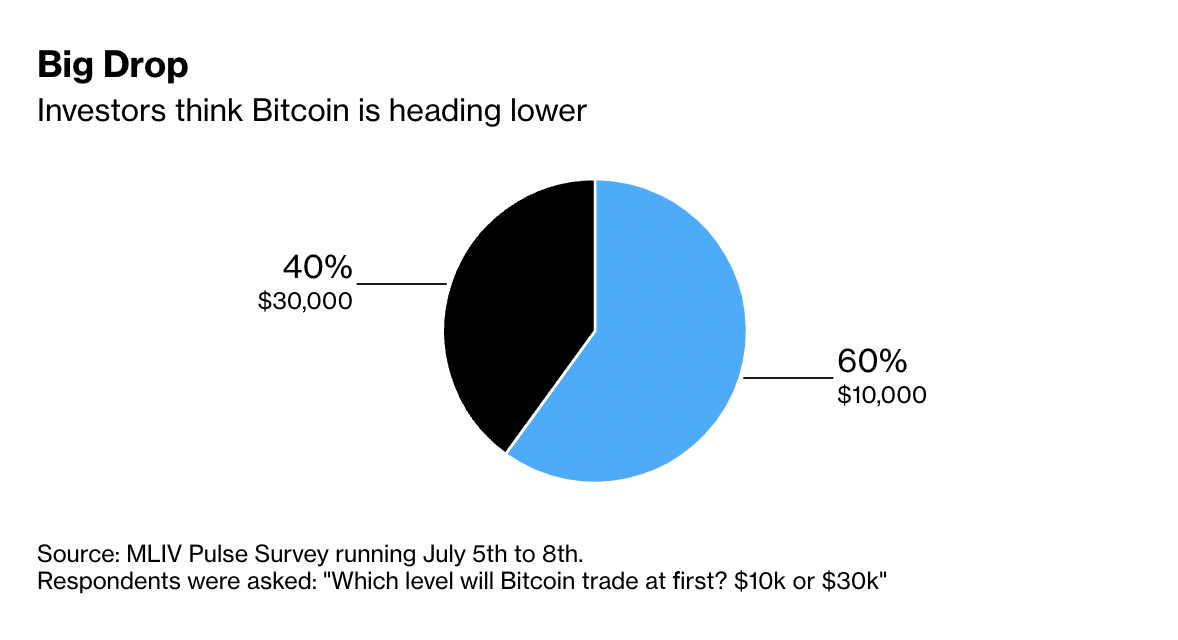
The BTC/USD pair has been flirting with the level for almost a month, with the latest MLIV Pulse survey noting that its price has more possibility to fall toward $10,000 than rebound toward $30,000.
The fears emerge due to an ongoing crypto market carnage led by the failure of several high-profile companies.

Meanwhile, hawkish central bank policies that focus on removing excess cash from the economy have also spooked investors.
Nevertheless, Bitcoin could rebound to at least $30,000 if the given bottom fractal plays out. The interim upside target coincides with the 0.236 Fib line of the Fibonacci retracement graph drawn from the $69,000-swing high to the $17,000-swing low, as shown in the chart above.
The views and opinions expressed here are solely those of the author and do not necessarily reflect the views of Cointelegraph.com. Every investment and…
Click Here to Read the Full Original Article at Cointelegraph.com News…


