Welcome readers, and thanks for subscribing! The Altcoin Roundup newsletter is now authored by Cointelegraph’s resident newsletter writer Big Smokey. In the next few weeks, this newsletter will be renamed Crypto Market Musings, a weekly newsletter that provides ahead-of-the-curve analysis and tracks emerging trends in the crypto market.
The publication date of the newsletter will remain the same, and the content will still place a heavy emphasis on the technical and fundamental analysis of cryptocurrencies from a more macro perspective in order to identify key shifts in investor sentiment and market structure. We hope you enjoy it!
Time to go long?
This week, Bitcoin’s (BTC) price has perked up, with a surge to $21,000 on Oct. 26. This led a handful of traders to proclaim that the bottom might be in or that BTC is entering the next phase of some technical structure like Wyckoff, a range break or some sort of support resistance flip.
Prior to getting all bullish and opening 10x longs, let’s dial back to a previous analysis to see if anything in Bitcoin’s market structure has changed and whether the recent spat of bullish momentum is indicative of a wider trend change.
When the last update was published on Sept. 30, Bitcoin was around $19,600, which is still within the bounds of the last 136 days of price action. At the time, I had identified bullish divergences on the weekly relative strength index (RSI) and moving average confluence divergence (MACD). There were also a handful of potential “bottoming” signals coming from multiple on-chain indicators, which were at multi-year lows.
Let’s take a look at how things are looking now.
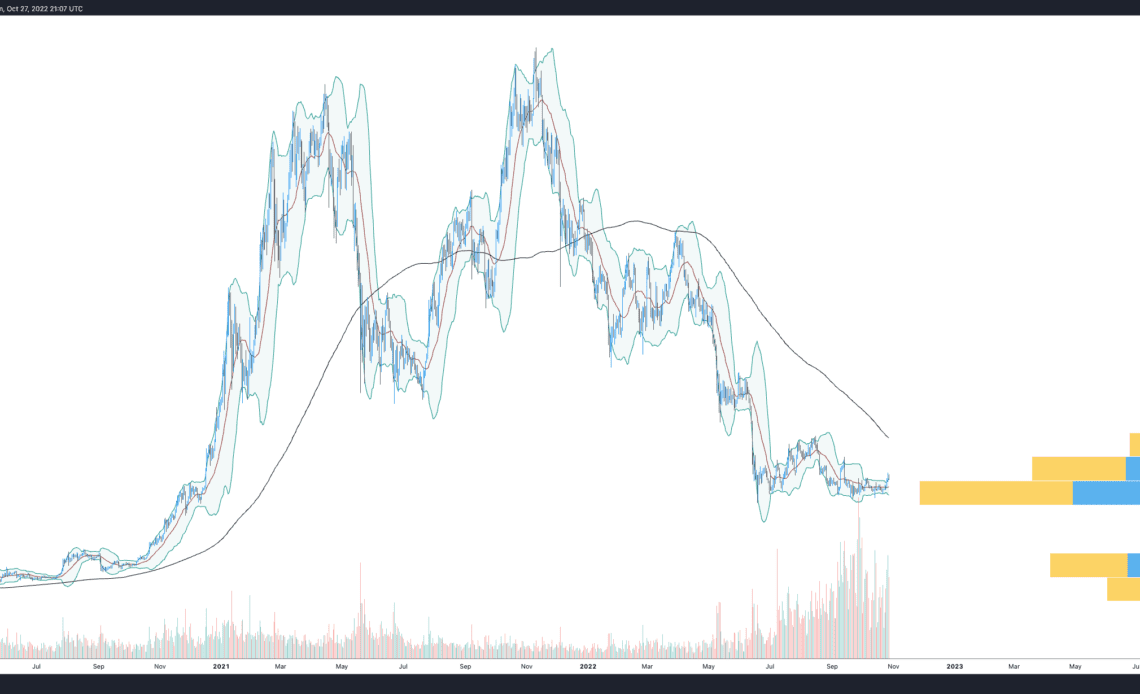
The Bollinger Bands are tight
The Bollinger Bands on the daily time frame remains constricted, and this week’s surge to $21,000 was the expansion or spike in volatility that most traders have been expecting. As is par for the course, after breaking out from the upper arm, the price has retraced to test the mid-line/mid-band (20MA) as support.
Despite the strength of the move, the price remains capped below the 200-MA (black line), and it is unclear at this moment if the 20-MA will now serve as support for Bitcoin’s price.
After bouncing off a near-all-time low at 25.7, the weekly RSI continues to trend upward and the bullish divergence identified in the previous analysis remains in play. A similar trend is also being held by BTC’s weekly MACD.
In…
Click Here to Read the Full Original Article at Cointelegraph.com News…


