Bitcoin price has again registered an uptick in the last 24 hours. In that timeframe, the coin has surged by 3%. This has also helped other major altcoins turn green at press time.
In the past week, BTC has rallied almost 8%. If the bulls keep pushing, then claiming the $21,000 mark would not be a difficult move for the Bitcoin price.
The technical outlook has again turned towards the bulls. Buyers have taken control of the price in the market. Demand has also gone up for the asset.
The chance of a price pullback cannot be ruled out completely. The coin has to barrel past its overhead resistance in order to touch the $21,000 price mark.
Even if the coin revisits the $21,000 level, it is important that BTC trades above that level for a long enough time in order for the bulls to stick around, leading to a wider trend change.
There could be difficult resistance for the Bitcoin price at $20,800. Clearing that level can help the coin move to $21,000.
For Bitcoin to continue its bullish thesis, upon toppling over the $21,000 price level, the price ceiling of $21,200 has to be broken past.
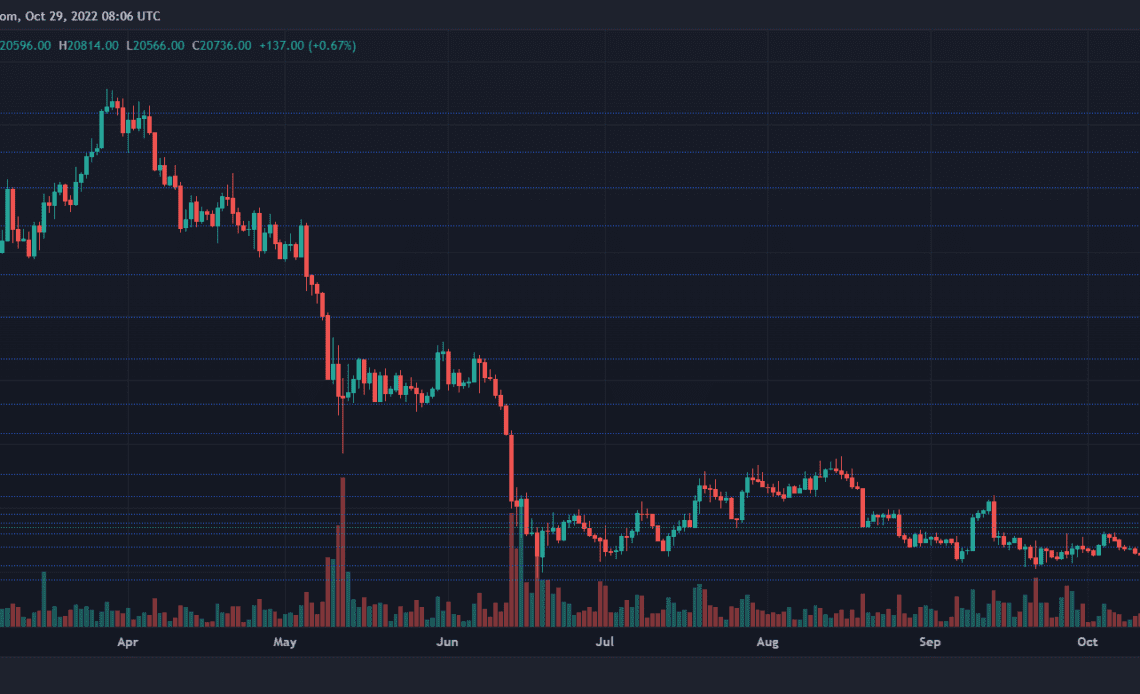
Bitcoin Price Analysis: One-Day Chart
BTC was trading at $20,700 at the time of writing. The Bitcoin price has again reclaimed the $20,700 price level as it fell south on its chart in the past two days.
If demand keeps up, then BTC will attempt to trade near the $21,000 price level. The overhead resistance for the coin was $20,800.
BTC can reach $21,000 if it breaks above this level. Another major resistance mark for BTC awaits at $21,600.
Going past the aforementioned level could be the beginning of a wider trend change.
On the other hand, losing $20,700 will bring BTC to $20,300 and then to $19,600.
The amount of BTC traded in the last trading session was in the green, which signified that buying strength had ascended on the chart.
Technical Analysis
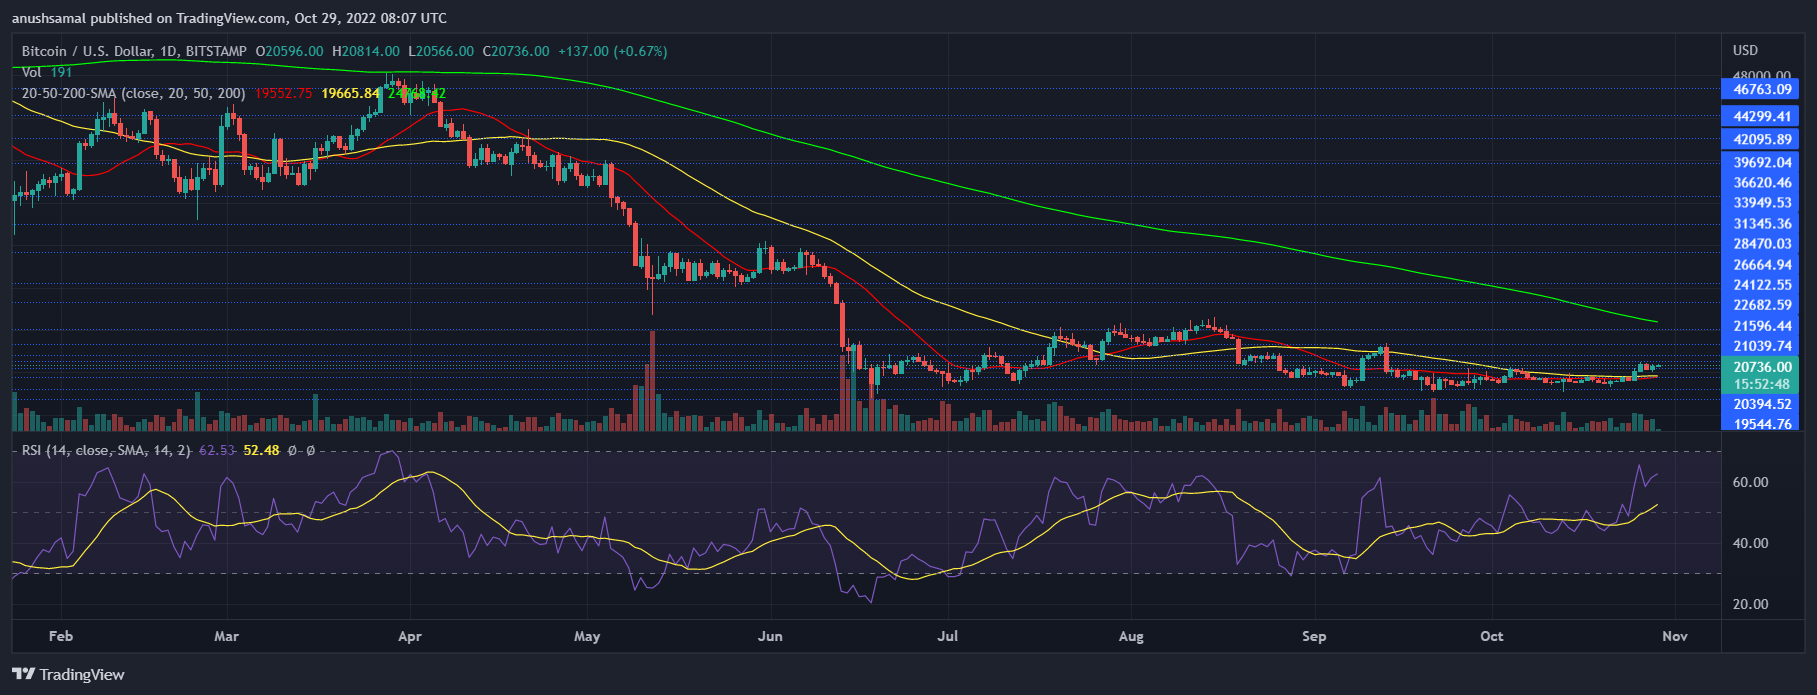
BTC had documented a fall in buying strength, at the time of writing, however, the coin displayed a steep recovery on its chart.
The last time BTC registered this amount of buying strength was almost 8 months ago. The Relative Strength Index shot past the 60-mark, which suggested that buying strength was a lot more than selling pressure.
The Bitcoin price was above the 20-SMA line, pointing towards the accumulation in…
Click Here to Read the Full Original Article at NewsBTC…


