A recent report by the research firm Delphi Digital illustrates the predictable consistency of price action and trends within the crypto market. The report delves into the interconnectedness between the 4-year Bitcoin (BTC) cycle and broader economic trends.
According to Delphi Digital analysts, the ongoing consolidation at $30,000 is similar to the period between 2015 and 2017, with indicators pointing toward an impending all-time high for Bitcoin by the fourth quarter of 2024.
Economic cycles impact on Bitcoin’s performance
Delphi’s analysis draws attention to the inherent cyclical nature of the cryptocurrency market. This cyclicality is demonstrated by the timing between peak-to-trough bottoms, recovery periods to previous cycle highs and the timing of price rallies to new cycle tops. Using Bitcoin as a benchmark, Delphi outlines the general blueprint of a cryptocurrency market cycle.
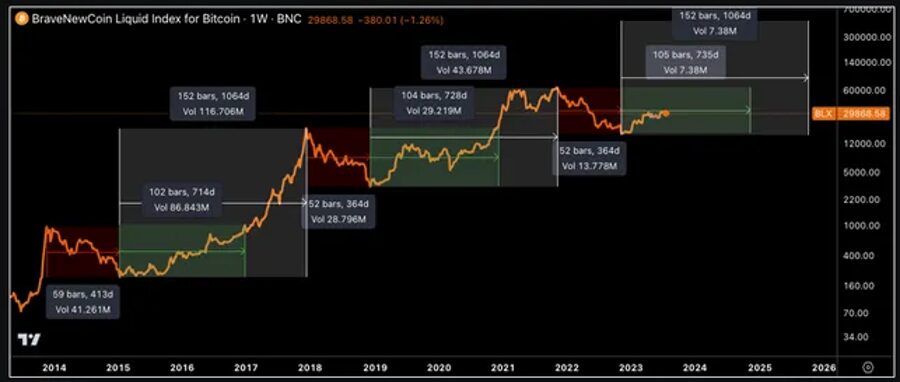
These 4-year cycles include Bitcoin hitting a new ATH, experiencing an approximate 80% drawdown, followed by a bottom around one year later. This tends to be followed by a two-year recovery to prior highs, and finally, a price rally for another year leading to a new all-time high.
The research reveals a fascinating correlation between Bitcoin price peaks and changes in the business cycle, as indicated by the ISM Manufacturing Index.
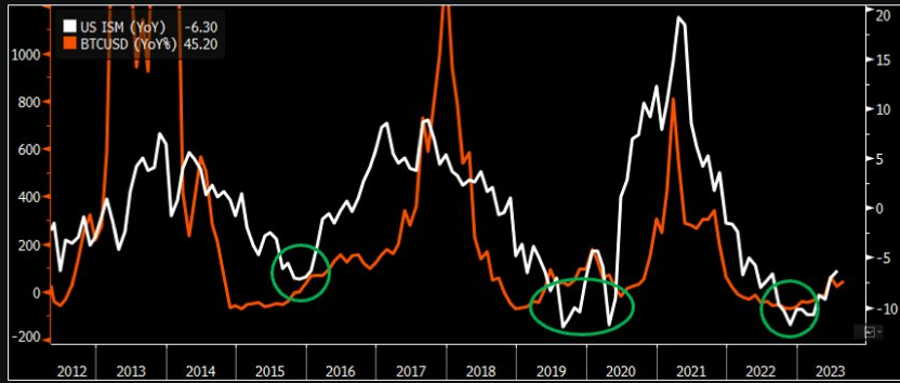
During Bitcoin’s price peaks, the ISM often demonstrates signs of topping out, and active addresses, transaction volumes, and fees reach their highest point. Conversely, as the business cycle signals recovery, so do network activity levels.
The report emphasizes the Bitcoin Halving’s role in these cycles. The last two halvings occurred about 18 months after BTC bottomed and roughly seven months before a new ATH. This historical pattern indicates a projected new ATH for Bitcoin by the fourth quarter of 2024, aligning with the expected timing of the next halving.
Bitcoin price action looks similar to theo 2015-2017 pre-bull run phase
The report also suggests that the current market environment shares striking similarities with the period between 2015 and 2017. The alignment of market behavior, economic indicators, and historical trends indicates that the current phase is akin to a time of increased risk exposure and potential growth, just as was…
Click Here to Read the Full Original Article at Cointelegraph.com News…


