
Bitcoin’s recent surge past $34,000 has been a significant event in the cryptocurrency market. Monitoring miner behavior and metrics is paramount when analyzing the Bitcoin market, as miners play a foundational role in network security, transaction validation, and new Bitcoin issuance. Their actions and decisions can offer insights into market trends, future price movements, and overall network health.
Between October 15 and 16, the mining difficulty of Bitcoin increased by 6.47%. This adjustment, which occurred as Bitcoin surpassed $28,000, reflects the network’s self-regulating mechanism to maintain consistent block times. As the price rose, it’s likely more miners were incentivized to join the network, escalating the competition. Consequently, while the increased price means rewards in USD value are higher, the intensified competition might make obtaining Bitcoin slightly more challenging.
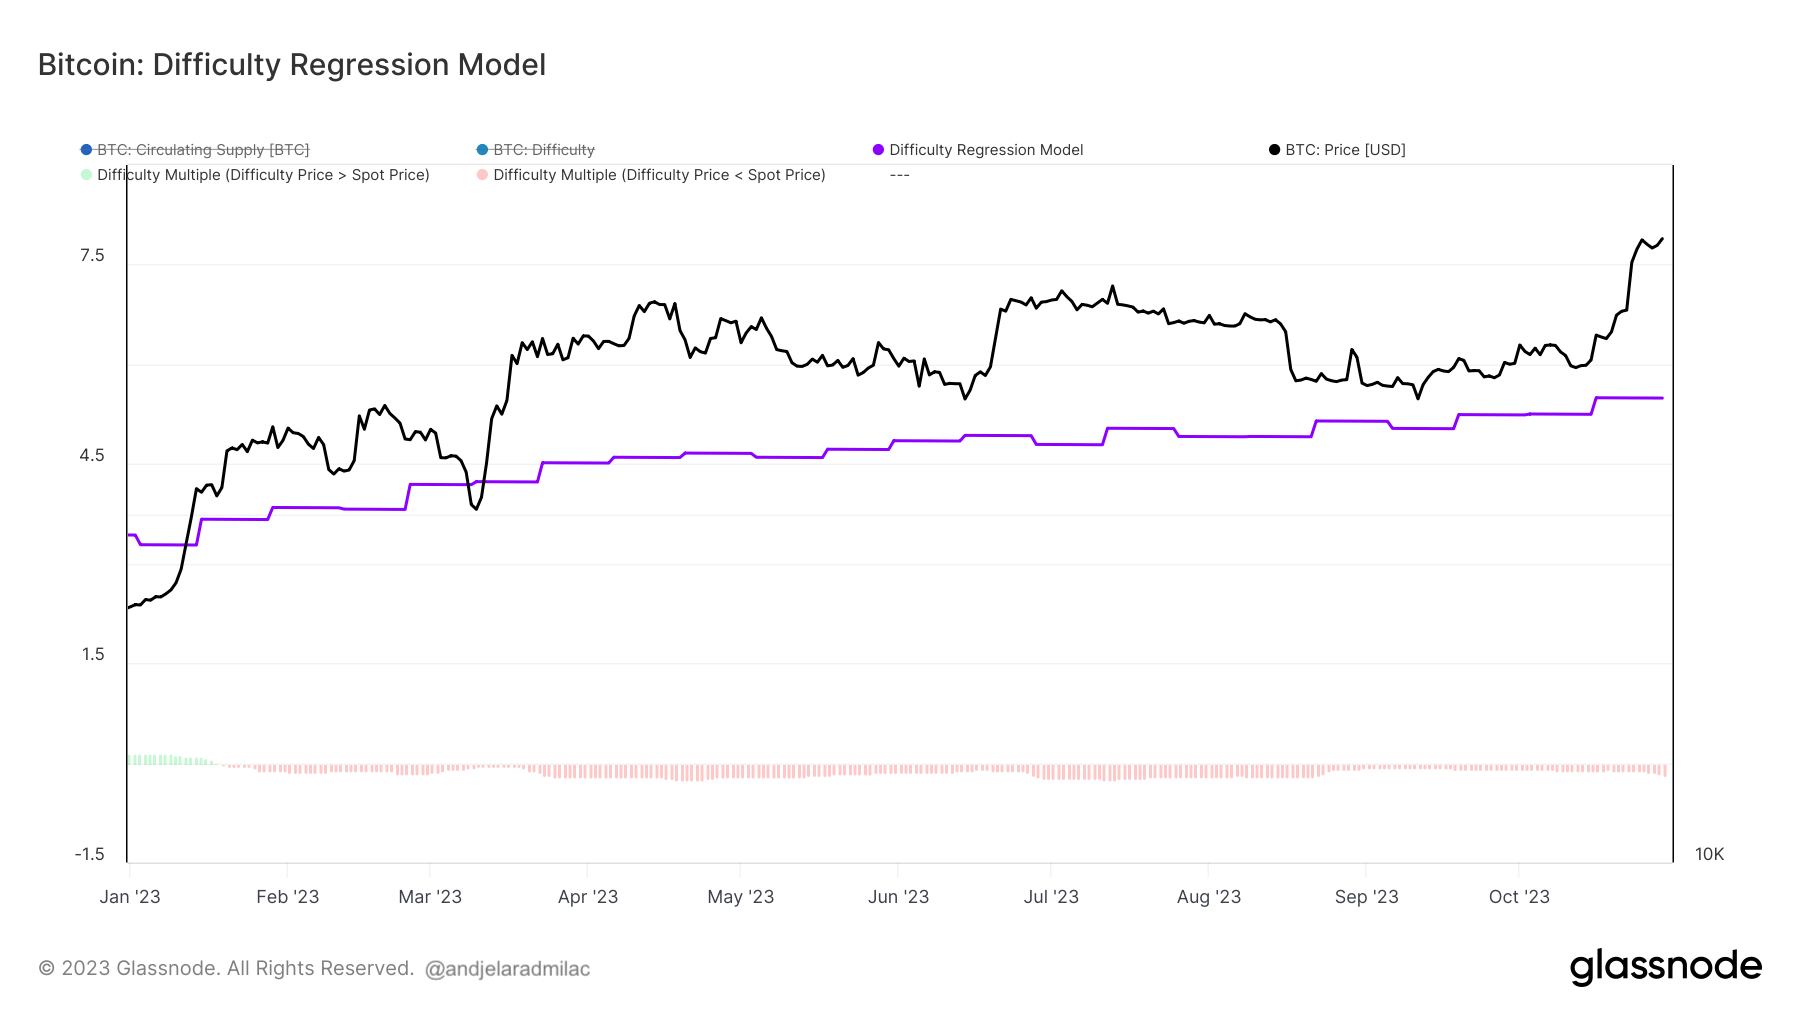
The difficulty regression model provides further clarity on the mining landscape. It represents the estimated cost of producing a Bitcoin. On October 15, this cost was $24,370, which modestly increased to $25,169 by October 29. This metric is crucial as it offers an understanding of the profitability landscape for miners. The growing disparity between the production cost and market price suggests a favorable profit margin, which could in turn, draw more participants to mining, augmenting the network’s overall security.
Miner revenue, another pivotal metric, underwent a significant change in October. As Bitcoin’s price escalated, so did the revenue for miners. The 365-day rolling sum of miner revenue, a comprehensive measure of their annual earnings, surpassed its 365-day simple moving average on September 9, and by October 29, it stood at a substantial $8.7 billion. This indicates a consistent and robust revenue stream for miners, which can be interpreted as a period of heightened activity and profitability.

Lastly, the miner balance metric offers a window into miner sentiment and strategy. Excluding the Patoshi pattern, the balance rose from…
Click Here to Read the Full Original Article at Bitcoin (BTC) News | CryptoSlate…


