Key points:
-
Bitcoin is showing a negative divergence on the charts, signaling a weakening in bullish momentum.
-
Buyers need to maintain Ether above $4,094 to retain the upper hand.
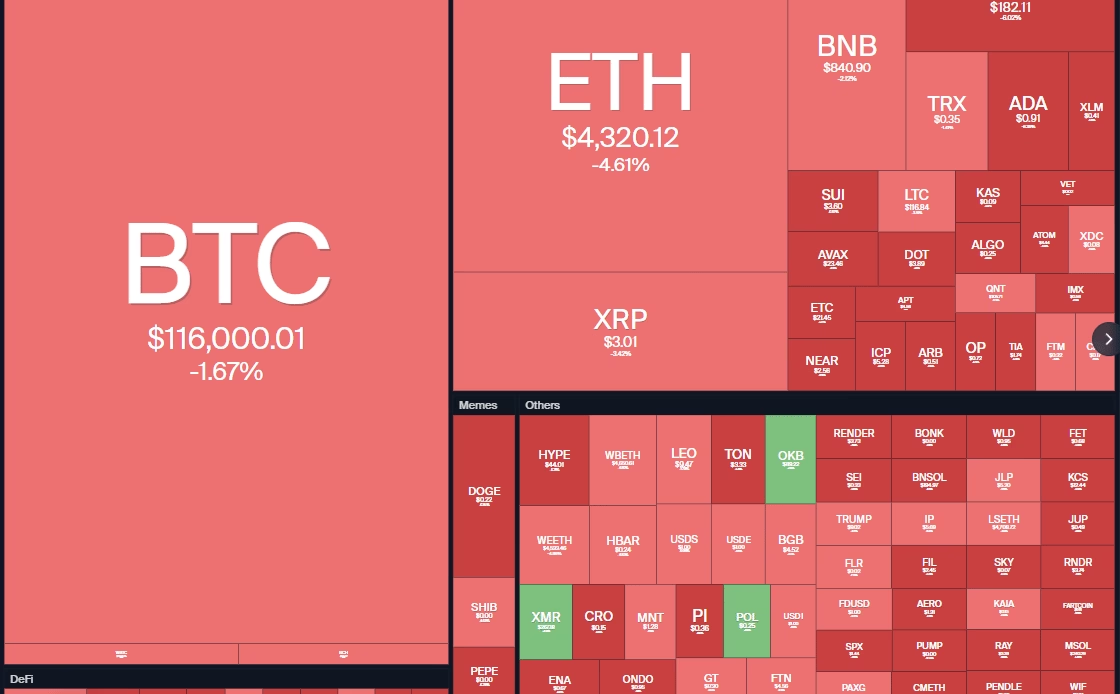
Bitcoin (BTC) extended its pullback on Monday, suggesting profit booking by short-term traders. Analyst Captain Faibik said in a post on X that BTC could drop to the key $98,000–$100,000 psychological zone in case of an “extreme bearish flush.”
Despite the correction, analysts expect Bitcoin to trade higher over the next few months. Canary Capital CEO Steven McClurg said in a CNBC interview that there is a greater than 50% chance of BTC reaching the $140,000 to $150,000 zone this year before the bear market next year.
The retail crowd has been bullish on BTC but has not shown the same enthusiasm for Ether (ETH) despite the strong performance over the past 30 days, according to sentiment platform Santiment. As the markets generally move opposite to retail’s expectations, Santiment believes ETH has a “slightly more bullish path” compared to BTC.
Could BTC form a higher low, signaling strength? Will altcoins follow BTC higher? Let’s analyze the charts of the top 10 cryptocurrencies to find out.
S&P 500 Index price prediction
The S&P 500 Index (SPX) remains in a strong uptrend, indicating that the buyers are in command.

A minor negative is that the relative strength index (RSI) is forming a negative divergence pattern. That suggests a pullback or consolidation in the near term. A break and close below the 20-day exponential moving average (6,370) could accelerate selling. The index may then plummet to the 50-day simple moving average (6,237).
Contrary to this assumption, if buyers thrust the price above 6,500, the index could start the next leg of the uptrend to 6,696.
US Dollar Index price prediction
The US Dollar Index (DXY) has been witnessing a tough battle between the bulls and the bears at the moving averages.
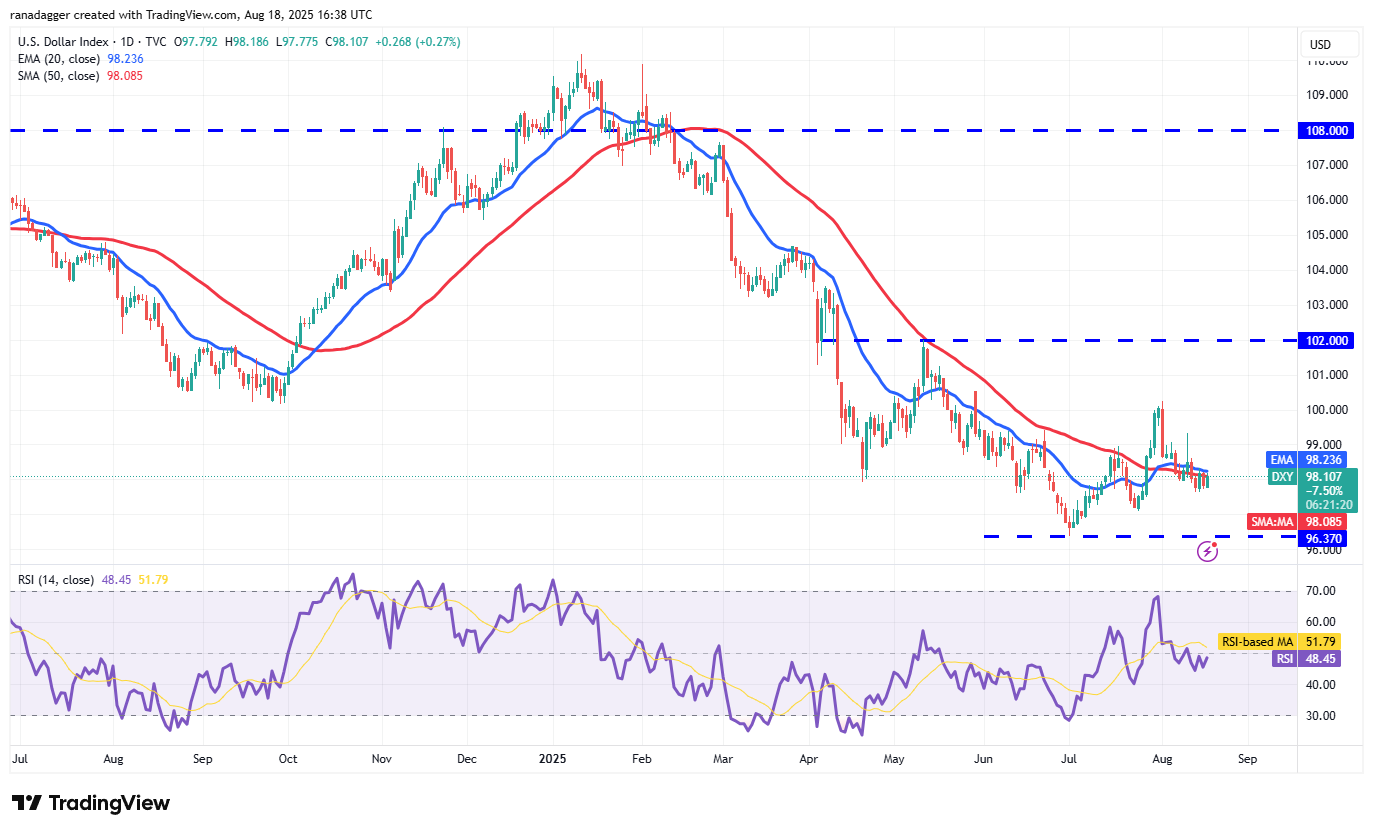
The marginally downsloping 20-day EMA (98.23) and the RSI just below the midpoint indicate a minor advantage to the bears. If the price breaks below 97.62, the index could tumble to 97.10.
Conversely, a break and close above the 20-day EMA shows demand at lower levels. The bulls will then try to push the price to 99.32 and subsequently to 100.25. Such a move suggests the index could swing between 96.37 and 102 for some…
Click Here to Read the Full Original Article at Cointelegraph.com News…


