In a detailed market update, Charles Edwards, founder of Capriole Investment, has provided an in-depth analysis of Bitcoin’s current market position, highlighting a pivotal shift to an ‘expansion’ phase in the Bitcoin Macro Index. This transition is particularly noteworthy as it parallels conditions observed prior to historical price surges in Bitcoin’s valuation.
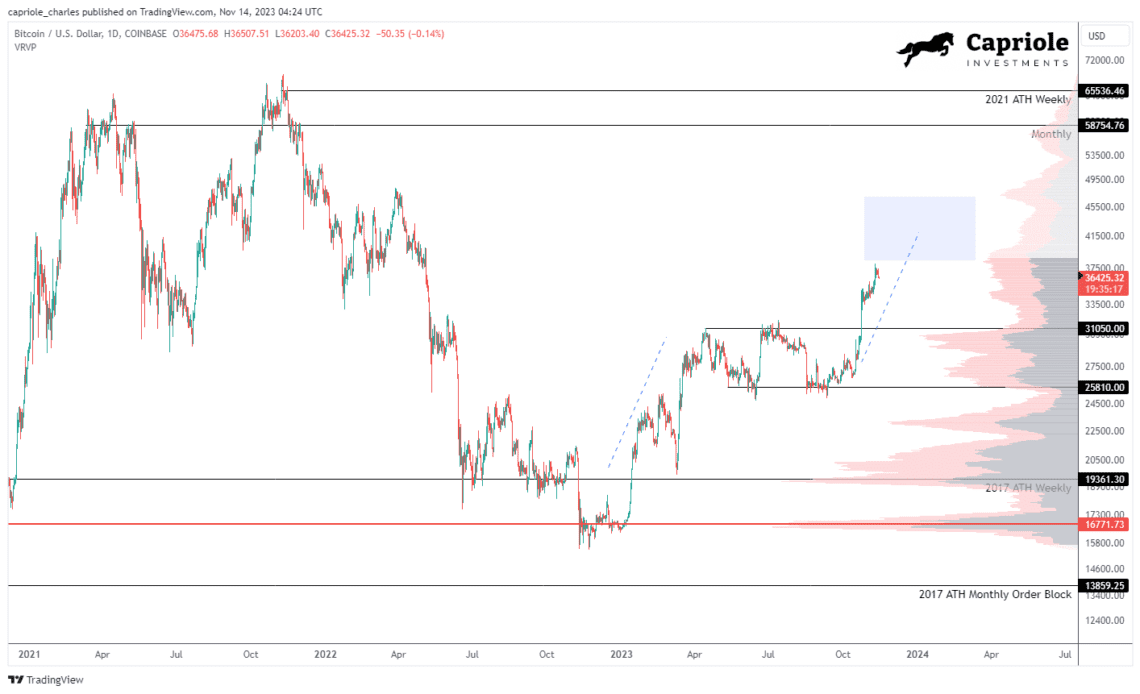
Bitcoin has recently experienced a sharp uptick, ascending from $34,000 to an interim high of $38,000. After a brief period of resistance, the price corrected to approximately $36,500. Edwards highlights this movement as a critical technical victory, with Bitcoin overcoming and holding above the major resistance benchmarks of $35,000 on both the weekly and monthly timeframes.
This consolidation above key resistance levels sets a bullish context in the high timeframe technical analysis, positioning Bitcoin in a strong technical stance according to traditional market indicators. “The recent breakout into the 2021 range offers the best high timeframe technical setup we have seen in years. Provided $35K holds on a weekly and monthly basis in November, the next significant resistance is range high ($58-65K).”
Bitcoin Macro Index Enters Expansion
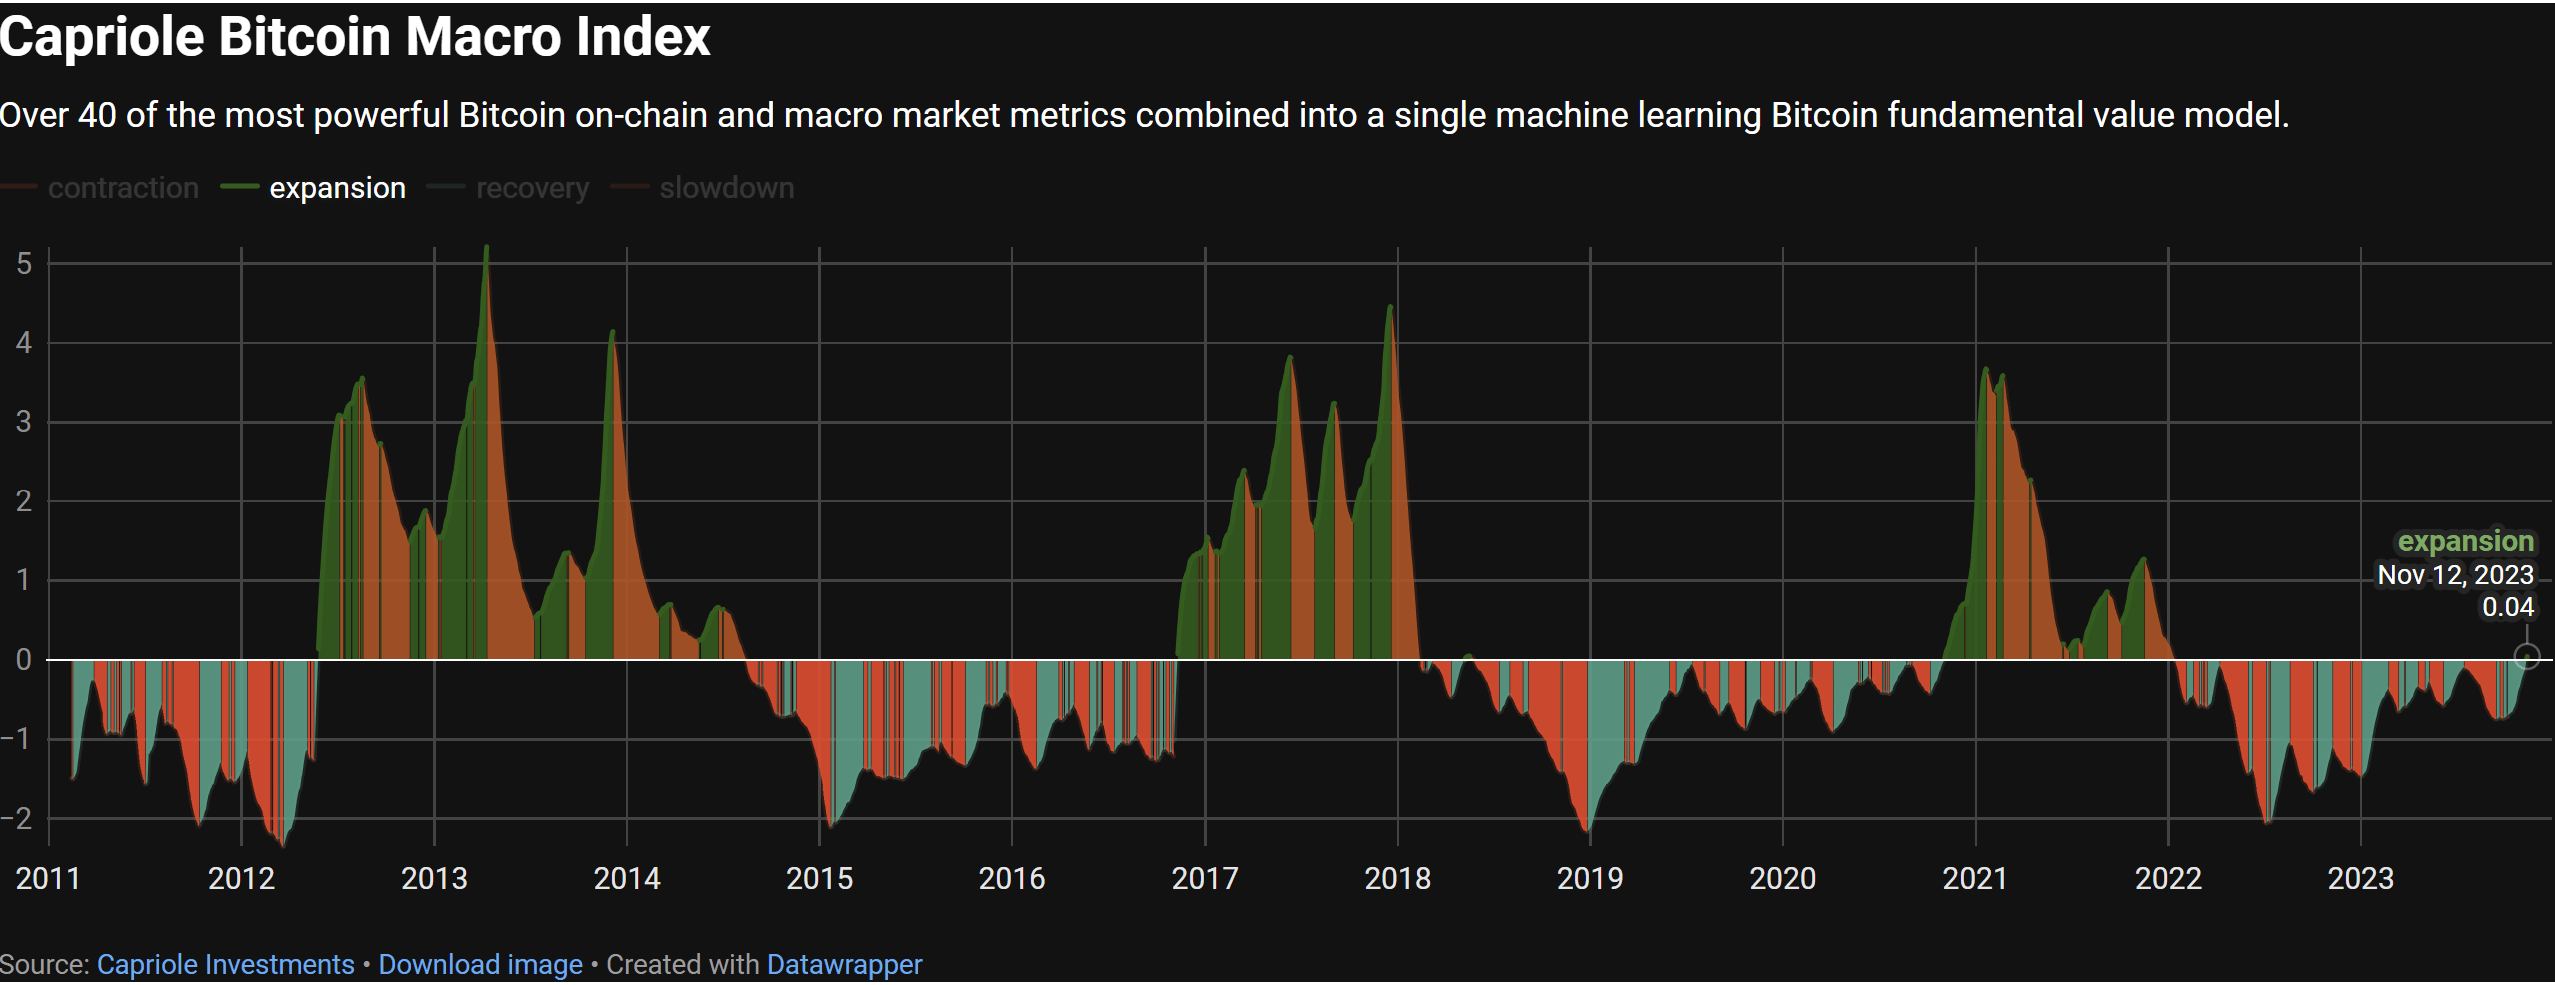
The crux of Edwards’ update is the shift in the Bitcoin Macro Index, a complex model synthesizing over 40 metrics encompassing Bitcoin’s on-chain data, macro market indicators, and equity market influences. The index does not take price as an input, thus providing a ‘pure fundamentals’ perspective.
The current expansion is the first since November 2020, and only the third instance since the index’s inception, with the two previous occasions leading to substantial price rallies in the following periods. Edwards elucidates this with a direct quote: “The transition from recovery to expansion is simply the optimal time to allocate to Bitcoin from a risk-reward opportunity for this model.”
A look at the Bitcoin chart reveals that the Bitcoin price rose by a whopping 400% during the last bull run from early November 2020 to November 2021, after the Macro Index entered the expansion phase. The first historical signal was provided by the Macro Index on November 9, 2016, which was followed by a massive bull run of almost 2,600% until Bitcoin reached its then all-time high of $20,000 in February 2018.
Click Here to Read the Full Original Article at NewsBTC…


