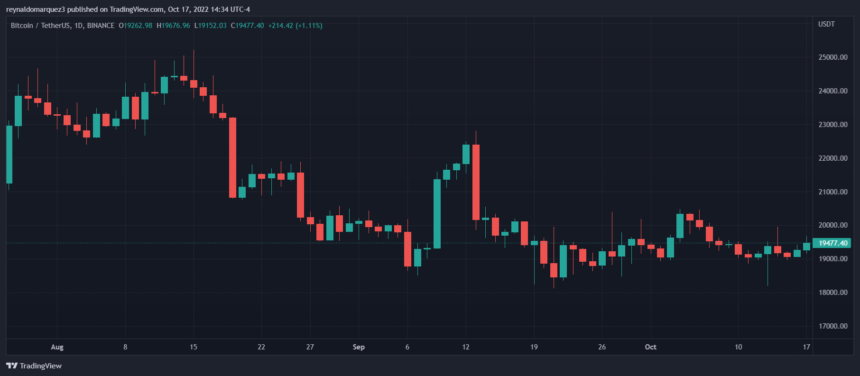
Bitcoin has been moving sideways for the better part of a week after rebounding from a monthly low at around $17,900. The number one cryptocurrency hinted at a potential breakout, but once again the bulls are losing momentum leaving BTC’s price stuck at its current levels.
At the time of writing, Bitcoin (BTC) trades at $19,500 with a 2% profit in the last 24 hours and sideways movement over the past week. The crab-like price action is replicating throughout the crypto market with large assets moving either sideways or to the downside.
Bitcoin Is Forming A Convincing Bottom?
Data from research firm Santiment indicates that Bitcoin has been moving sideways for the past 4 months with spikes in volatility over that period. Regardless of BTC’s price, the research firm claims that the cryptocurrency might be in the process of bottoming based on several metrics.
First, Santiment looked into the cryptocurrency’s distribution or the amount of BTC currently being sold in the market. After the pronounced crash from the 2021 highs, the current BTC market, the research firm claims, is looking like the 2017 to 2019 period.
As seen in the chart below, the price of Bitcoin saw a decline in its mean dollar invested age (BTC) and its Market Value To Realized Value, a metric used to gauge investor behavior. As seen in the chart below, when the MVRV crashed, with the mean dollar invested going the opposite, Bitcoin tends to move sideways.
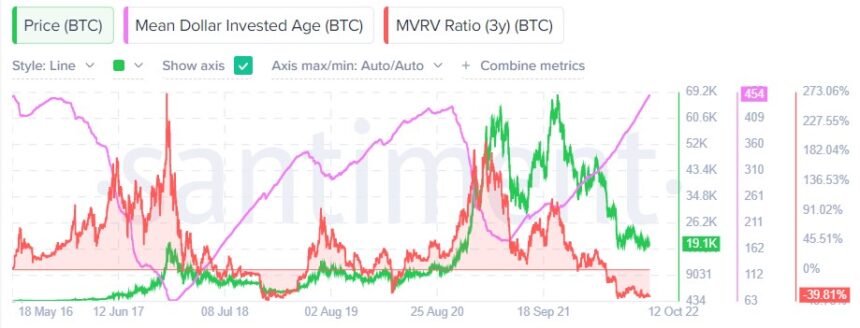
This crab-like price action can last for many years, but they hint at the cryptocurrency finally reaching a long-term bottom. In addition, social volume, the number of people talking about Bitcoin on social media, has been declining following the price action.
This indicates that levels of euphoria are low and approaching their 2018 bottom. During these times, there are usually levels of leverage and speculation in the market.
Santiment wrote the following on the similarities between Bitcoin’s current price and its 2018 price action. At that time the cryptocurrency recorded a new all-time high, and went into a multi-year bear market:
Bitcoin’s long-term metrics have shown encouraging signs of a turnaround for a few months now, despite prices being stuck in the mud. (…) looking at the long-term data current situation doesn’t look as terrible as it might seem from the outside perspective. Of course,…
Click Here to Read the Full Original Article at NewsBTC…


