Bitcoin has finally reclaimed the highly anticipated $100K mark after days of consolidation and lingering negative sentiment. The psychological milestone had been a key resistance level, with many investors and analysts closely monitoring BTC’s price action for clues about its next big move. The recent breakout above $100K signals renewed market optimism, yet the question remains: can Bitcoin maintain its momentum?
Related Reading
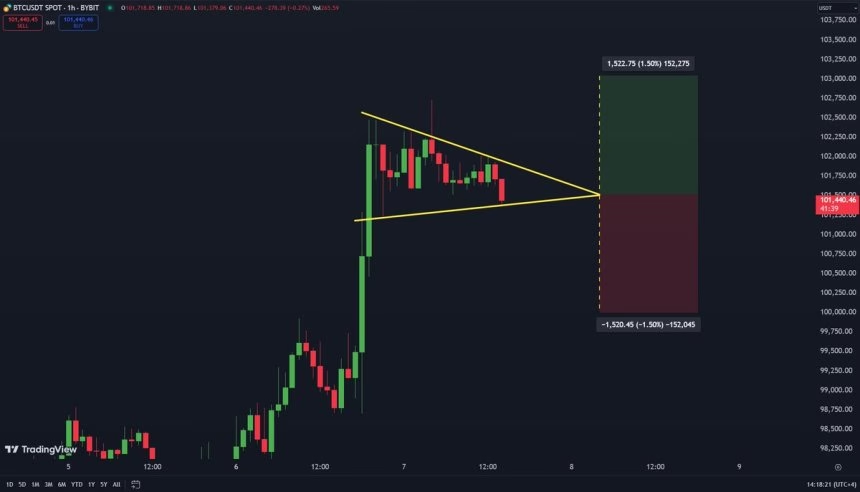
Top analyst Carl Runefelt shared a detailed technical analysis on X, highlighting a critical pattern forming in Bitcoin’s 1-hour time frame. According to Runefelt, Bitcoin is currently shaping a symmetrical triangle, a classic chart pattern that typically precedes a significant price movement. The pattern suggests that Bitcoin is coiling for a decisive breakout or breakdown, with the next few days—or even hours—potentially shaping its short-term trajectory.
This pivotal moment for Bitcoin comes as the broader crypto market experiences renewed energy following a sluggish end to the previous year. Investors are optimistic yet cautious, as the technical setup could signal either a continued rally or a temporary setback. With BTC back in six-figure territory, the stage is set for a critical period that could define the first quarter of 2025.
Bitcoin Breaks Above $100K But Faces Risks
Bitcoin has surged to $102,700 with impressive strength, fueling optimism for a highly bullish year ahead. Investors are closely watching the market leader, which continues to show resilience after reclaiming the $100K mark. However, BTC is not without risks; any loss of current levels could result in a significant pullback, potentially shaking confidence in the ongoing rally.
Top analyst Carl Runefelt recently shared a detailed technical analysis on X, highlighting Bitcoin’s formation of a symmetrical triangle on the hourly timeframe. This classic chart pattern often precedes a sharp breakout or breakdown, signaling heightened market activity. Runefelt emphasized that the next move could occur as the price consolidates tightly within the triangle.
Runefelt outlined key price targets for traders to watch. A close below the $100K mark would act as a bearish signal, potentially invalidating the bullish structure built over recent weeks. Conversely, a breakout above $103K…
Click Here to Read the Full Original Article at NewsBTC…


