The price of Bitcoin (BTC) in recent weeks has had a remarkable bounce and run from its low of $19,000, with many calling for a bull run. BTC’s price soon faced resistance and was rejected from the $25,200 mark as it formed a bearish rising wedge. The price of BTC broke out from the rising wedge, and BTC has struggled to hold off sell-off ahead of its daily (1D), weekly (1W), and monthly (1M) trilemma close. (Data from Binance)
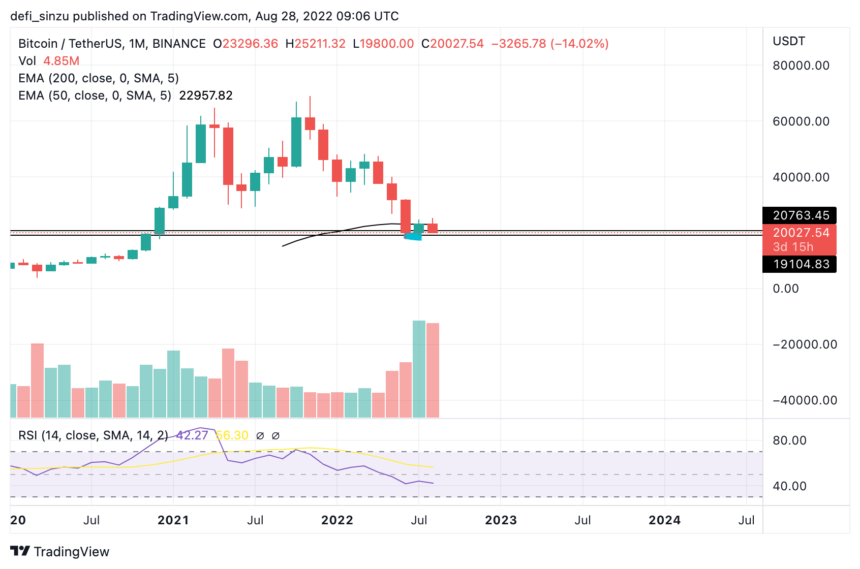
BTC Price Analysis On The Monthly Chart
From the chart, the price of BTC saw a bullish sentiment in July, with August looking bullish in its early week.
After seeing a monthly low of $18,000 with what seems to be a high demand area, the price of BTC bounced and rallied to a monthly close of $24,400. The price saw a rejection from $25,000 and has struggled to remain bullish as the price heads into its monthly close of August.
If BTC’s price closes below $19,500 on the monthly close, we could see the price going lower; BTC’s price needs to hold and bounce from this key area to save its price from going lower.
Monthly resistance for the price of BTC – $25,000.
Monthly support for the price of BTC – $19,000.
Price Analysis Of Bitcoin On The Weekly (1W) Chart
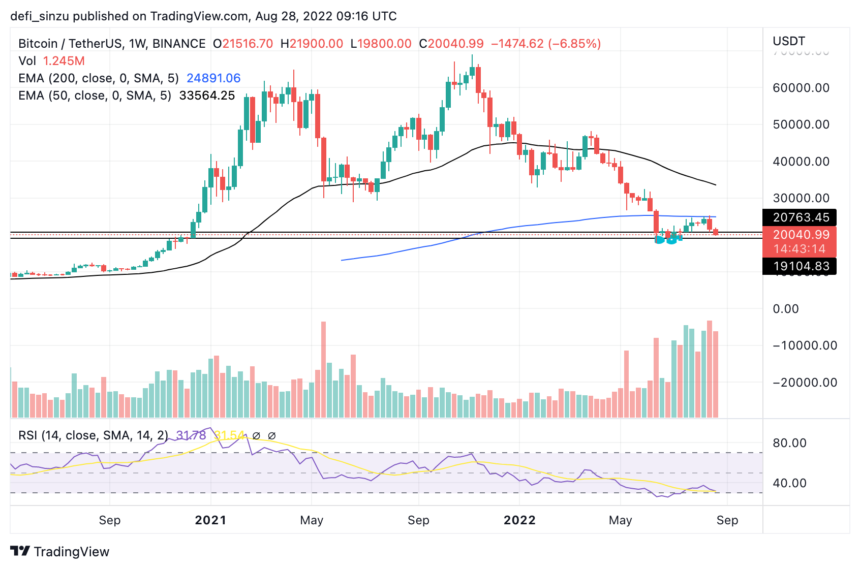
The price of BTC found a weekly low of $20,800 as price rallied to a high of $25,200; BTC’s price has struggled to trend higher as the price was rejected from that region, falling to $20,800 acting as a support area for BTC price.
BTC’s price could not hold above this support of $20,800 as it flips it into resistance as price eyes a key area of support acting as demand for prices.
The price of BTC needs to bounce off this area and trend higher to avoid the price from going lower; if the BTC price fails to hold off sellers, we could see the price of BTC trading in the region of $19,000 and possibly lower if this support area fails.
Weekly (1W) resistance for BTC price – $20,800, $25,200.
Weekly (1W) support for BTC price – $19,000.
Price Analysis Of BTC On The Daily (1D) Chart
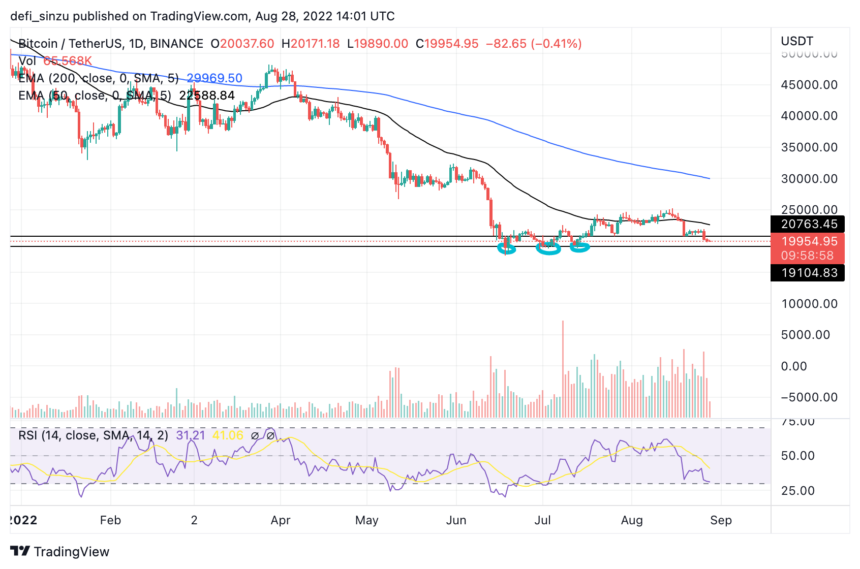
The price of BTC on the daily chart showed great strength, trying to hold above support areas but was overpowered by bears as the price fell from $25,200 to a region of $19,700 before a quick bounce from the area.
BTC’s price is currently trading at $20,000, holding the price from going lower; with more…
Click Here to Read the Full Original Article at NewsBTC…


