On-chain data shows Bitcoin is approaching the “Realized Price” of the short-term holders, a retest of which has historically been important for BTC.
Bitcoin Is Close To Seeing A Retest Of Short-Term Holder Cost Basis
In a new post on X, CryptoQuant Head of Research Julio Moreno has discussed how BTC has recently been near the Realized Price of the short-term holders.
Related Reading
The “Realized Price” here refers to an on-chain indicator that, in short, keeps track of the average price at which investors or addresses on the Bitcoin network acquired their coins.
When the cryptocurrency’s spot price is higher than this metric, it means that the average holder in the market is currently sitting on some profits. On the other hand, BTC’s value under the indicator suggests the dominance of losses among the investors.
Naturally, when the two are exactly equal, the market as a whole can be assumed to be holding an equal amount of unrealized profits and losses. The holders could collectively be considered just breaking even on their investment.
In the context of the current topic, the Realized Price of only a specific part of the sector is of focus: the short-term holders (STHs). The STHs are the investors who bought their coins within the past 155 days.
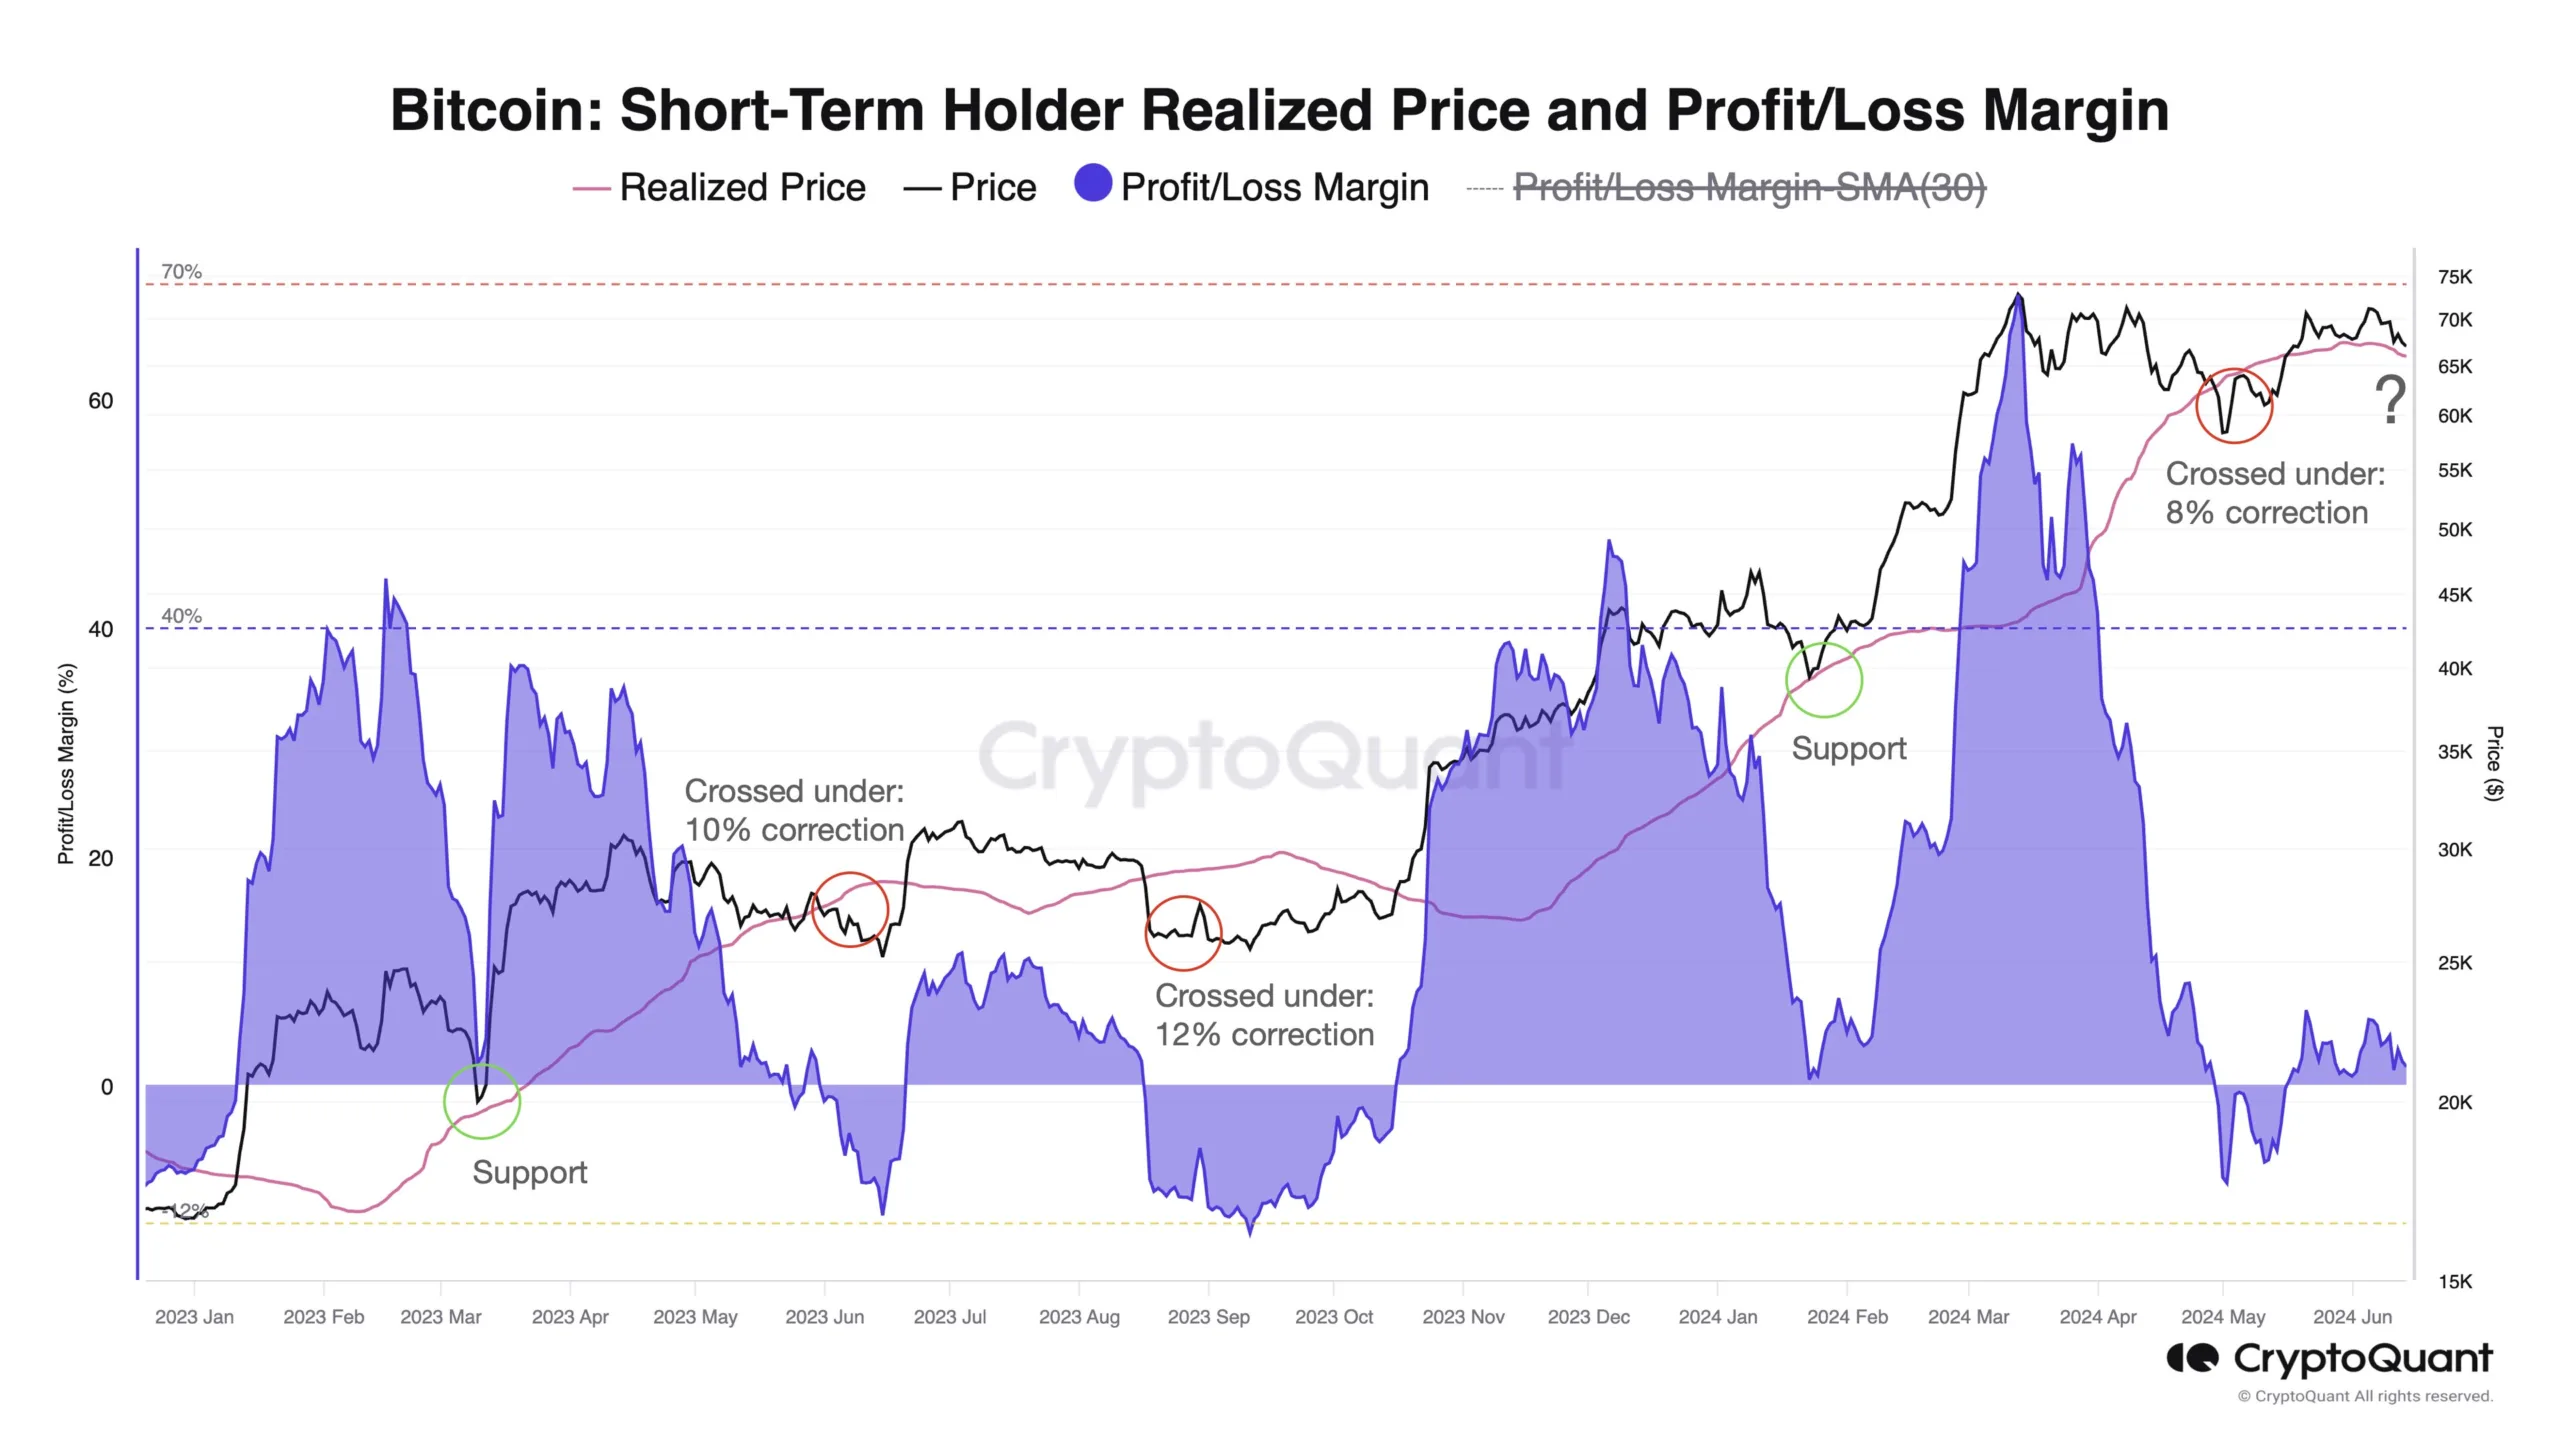
Below is a chart that shows the trend in the Realized Price of the Bitcoin STHs over the past couple of years:
The above graph shows that the Bitcoin price is close to the Realized Price of the STHs. This means that the margin is small, although these investors are sitting in profits right now.
Thus, it’s possible that if the cryptocurrency continues on its latest bearish trajectory, a retest of the average cost basis of this cohort could be imminent. In the past, such retests have proven relevant for the asset.
Moreno has highlighted in the chart the interactions the asset’s spot value has shown with this level during the last two years. It would appear that during two of these retests (marked with green circles), the coin found support at this level and rebounded upwards to continue the bullish momentum.
Related Reading
However, in the three other instances (red circles), Bitcoin failed to retest the level and observed a decline. These corrections were from 8% to 12%, and the latest occurrence of the trend was at the end of April/start of May.
With another retest…
Click Here to Read the Full Original Article at NewsBTC…


