In this episode of NewsBTC’s daily technical analysis videos, we take a look at the ongoing Bitcoin price breakout above the upper Bollinger Band on daily BTCUSD charts and provide some insight into what the next targets might be.
Take a look at the video below:
VIDEO: Bitcoin Price Analysis (BTCUSD): October 26, 2022
The breakout across crypto has already resulted in a substantial amount of shorts liquidated. How far could this Bitcoin rally run?
Bitcoin Rally Approaches Middle Of Trading Range
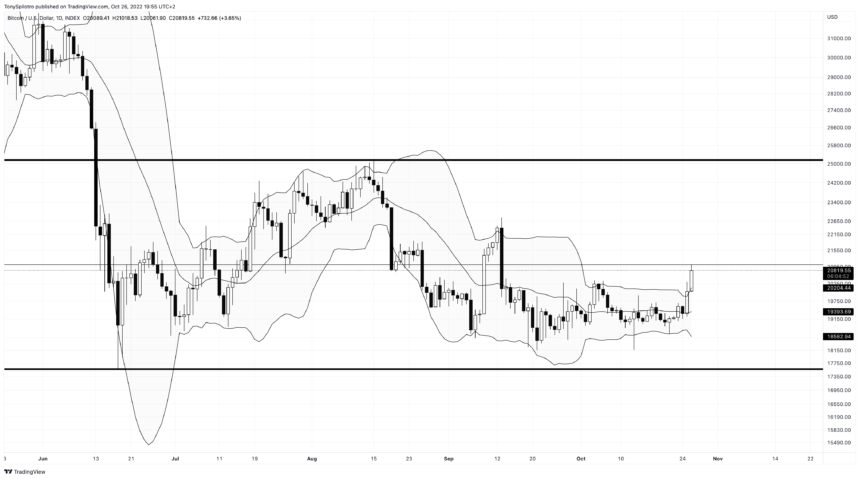
Bitcoin price is now at the middle-point of a horizontal trading range, making for a natural stopping point for profit-taking and to draw in a fresh set of short positions. Busting through the range median will result in another attempt at around $25K.
More importantly, the Bitcoin price is continuing to make a strong push outside of the Bollinger Bands on daily timeframes. After tightening for so long, and now starting to expand, the rally could have more legs than bears expect.
BTC is attempting to break through the median of a the trading range | Source: BTCUSD on TradingView.com
Related Reading: Can Bitcoin Bring An End To Crypto Winter? | BTCUSD Analysis October 24, 2022
BTCUSD Weekly Hits Resistance At Middle Bollinger Band
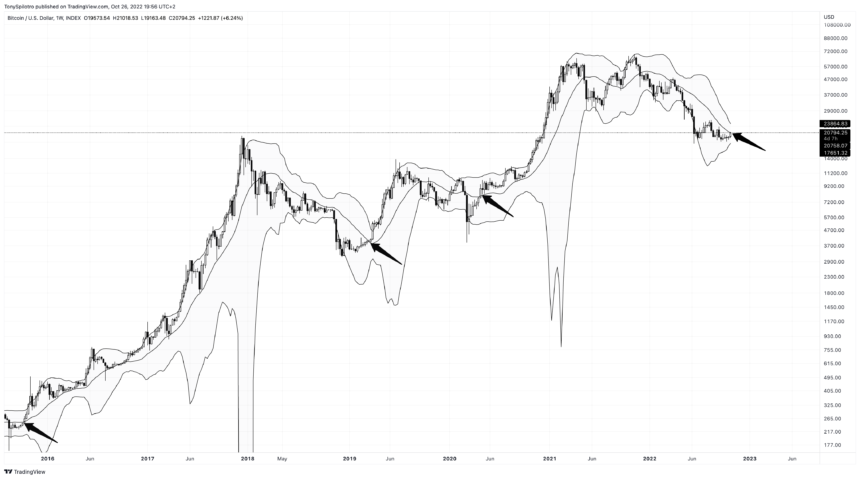
That is because Bitcoin price has already found and met resistance at the mid-Bollinger Band on weekly timeframes. The key resistance level at the 20-week SMA, was where I placed a hedge short entry today in case the rally is rejected instead.
If there is no rejection and Bitcoin keeps rising, we could be looking at a full-blown return to a crypto bull run. Zooming out shows just how significant a weekly close above the middle Bollinger Band would be.
Turning on Bollinger Band Width shows that the bands are some of the tightest ever. The last two instances were prior to the 50% breakdown to the 2018 bear market bottom. Before that was prior to the epic 2017 Bitcoin bull run that made the cryptocurrency a household name.
Importantly, in 2018, Bitcoin price was below the mid-Bollinger Band, while in 2016 it was above the mid-BB. The trend is more likely to continue on whatever side of the mid-BB price is on. If the weekly BTCUSD chart closes above the middle band and holds, it could be off to the races once again for Bitcoin bulls.
Crypto Profit Targets To Watch For Using The Ichimoku
Back to those weekly Bollinger Bands, for a sense of…
Click Here to Read the Full Original Article at NewsBTC…


