Bitcoin (BTC) spending an “unprecedented” period below a key moving average is a poor guide to the 2022 bear market.
That was the opinion of analyst Superswell, who this week championed on-chain metrics as a way of understanding current BTC price action.
“Business as usual so far” for Bitcoin bear market
In a series of tweets on Dec. 5, Superswell challenged those concerned about the 200-week simple moving average (SMA) disappearing as support on BTC/USD.
“Over the last few months, I’ve seen quite a few people point out that BTC failing to find support at the 200wkSMA is unprecedented and therefore we’re in uncharted territory – especially considering how much time we have spent below,” part the thread read.
“This is where I personally feel that onchain data provides better information as to where we are in relation to historical capitulations than TA (ie: 200wkSMA).”
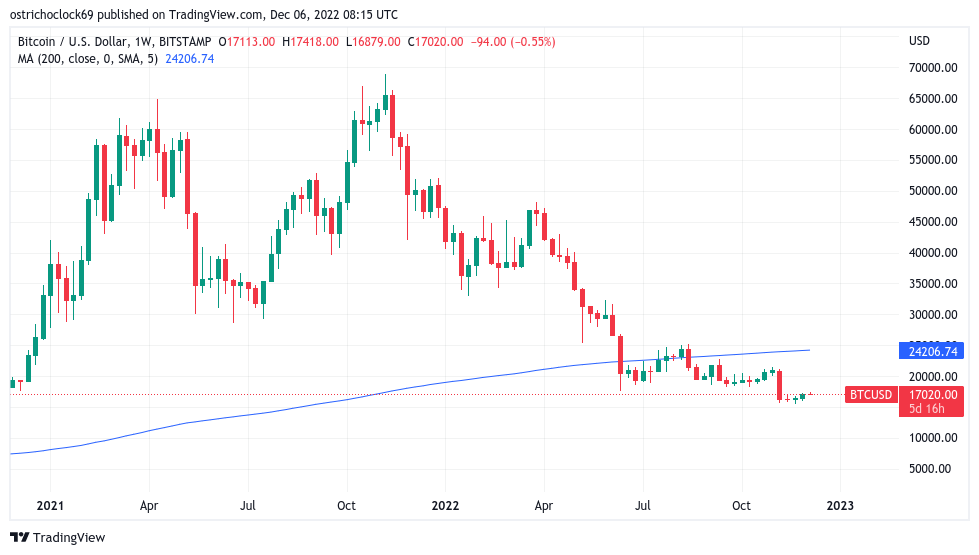
BTC/USD fell below the 200 SMA in mid-August, taking its stint with the trend line as resistance to nearly four months — a record, as confirmed by Cointelegraph Markets Pro and TradingView.
As Cointelegraph continues to report, however, on-chain data tells a different story, and has been compiling bear market bottom signals for weeks or longer.
Superswell highlighted four in particular from on-chain analytics firm, Glassnode: percent supply in profit, percent volume in profit, adjusted spent output profit ratio (aSOPR) and market value versus realized value (MVRV).
While these have so far not beaten (or in some cases, even matched) previous bear markets, this is no reason to fear the worst, Superswell continued.
“From an on-chain perspective, this is business as usual *so far* for a macro bottom and bear market,” he wrote.
“This is not to say that *because* these levels have been hit, we have therefore bottomed.”
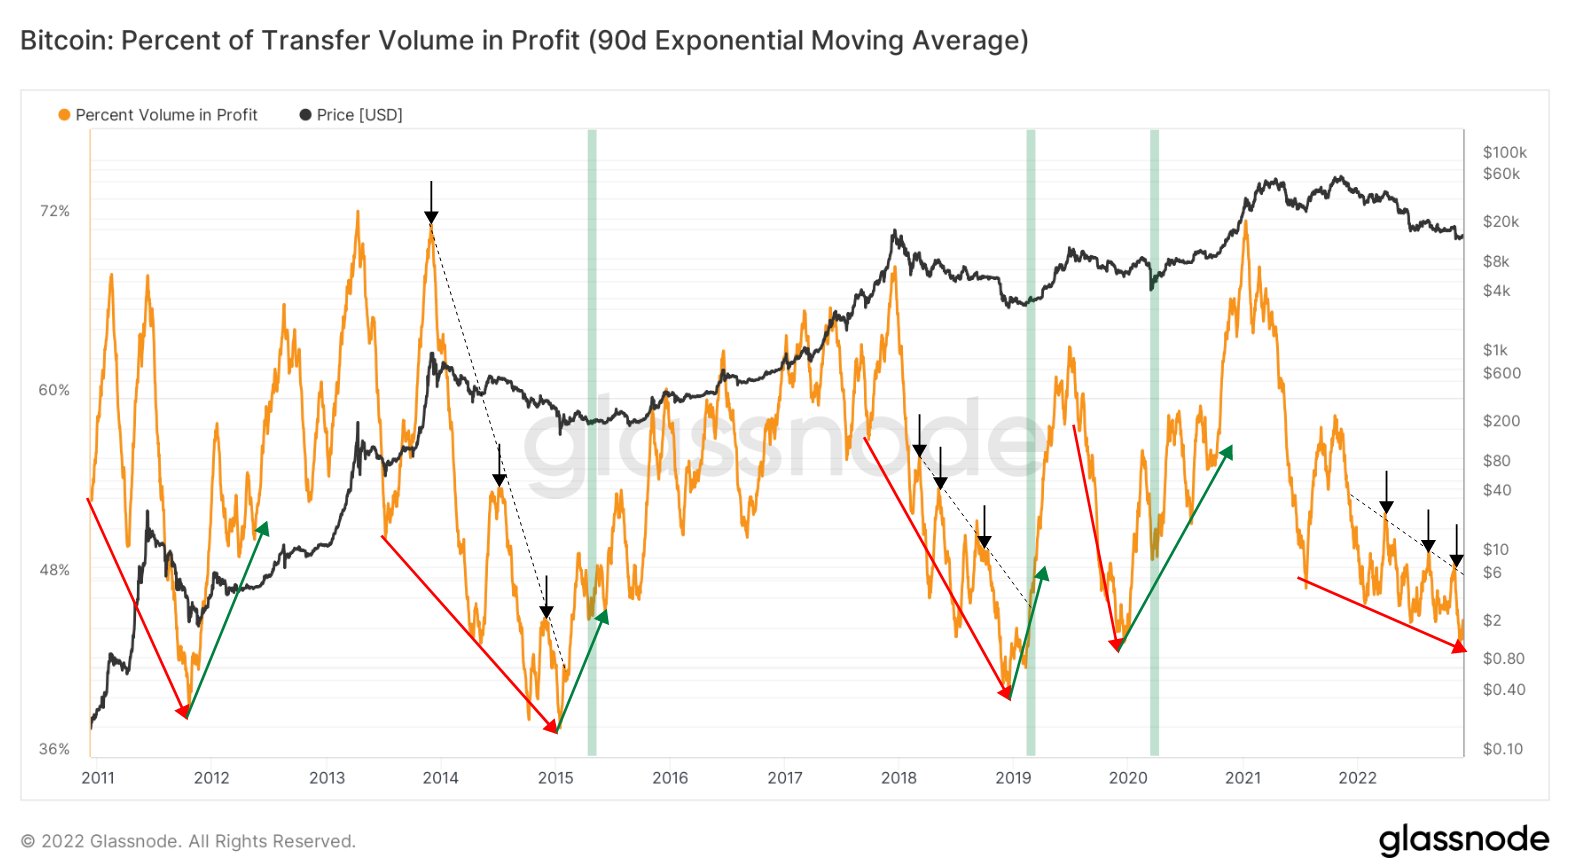
An example came in the form of percent volume in profit — a chart showing what portion of transaction volume involved coins moving at a higher price than they did last time.
Currently trending down, the metric needs to begin an uptrend — a series of higher swing lows and swing higher highs, which Superswell says would “confirm a macro reversal.”
“This is just an example of *one* reversal pattern. There are many to look for,” he noted.
Hopes of BTC price “macro regime shift”
Glassnode itself meanwhile also…
Click Here to Read the Full Original Article at Cointelegraph.com News…


