Bitcoin price failed to stay above the $68,500 support zone. BTC extended losses and now showing bearish signs below the $68,800 level.
- Bitcoin started another decline from the $70,150 resistance zone.
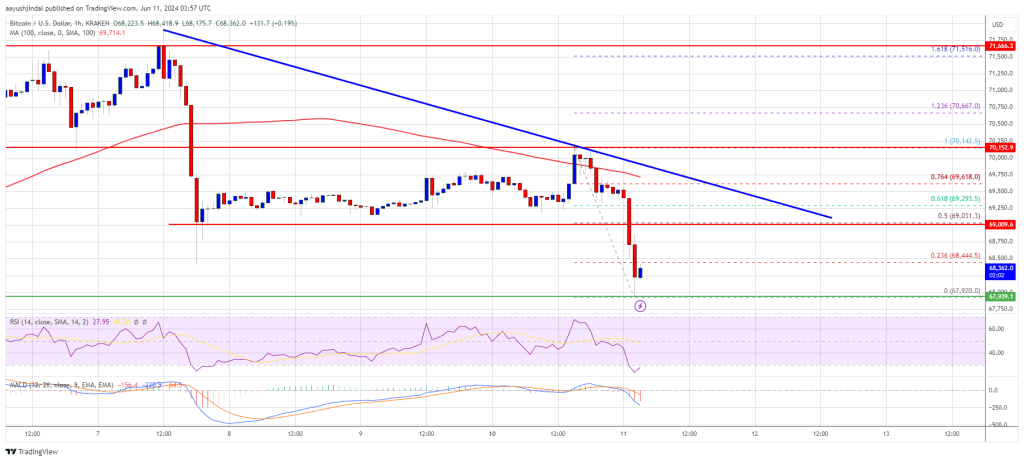
- The price is trading below $68,800 and the 100 hourly Simple moving average.
- There is a key bearish trend line forming with resistance at $69,500 on the hourly chart of the BTC/USD pair (data feed from Kraken).
- The pair could further if there is a clear move below the $68,000 level.
Bitcoin Price Dips Again
Bitcoin price attempted another increase above the $69,500 resistance zone. BTC even broke the $70,000 resistance zone but it failed to extend gains. A high was formed at $70,142 before there was a fresh decline.
The price declined below the $69,500 and $68,500 support levels. A low was formed at $67,920 and the price is now consolidating losses near the 23.6% Fib retracement level of the downward move from the $70,142 swing high to the $67,920 low.
Bitcoin is now trading below $69,500 and the 100 hourly Simple moving average. On the upside, the price is facing resistance near the $68,800 level. The first major resistance could be $69,000 and the 50% Fib retracement level of the downward move from the $70,142 swing high to the $67,920 low.
The next key resistance could be $69,500. There is also a key bearish trend line forming with resistance at $69,500 on the hourly chart of the BTC/USD pair. A clear move above the $69,500 resistance might send the price higher. In the stated case, the price could rise and test the $70,000 resistance. Any more gains might send BTC toward the $71,200 resistance.
More Losses In BTC?
If Bitcoin fails to climb above the $69,500 resistance zone, it could start another decline. Immediate support on the downside is near the $68,000 level.
The first major support is $67,650. The next support is now forming near $67,500. Any more losses might send the price toward the $66,400 support zone in the near term.
Technical indicators:
Hourly MACD – The MACD is now gaining pace in the bearish zone.
Hourly RSI (Relative Strength Index) – The RSI for BTC/USD is now below the 50 level.
Major Support Levels – $68,000, followed by $67,500.
Major Resistance Levels – $69,000, and $69,500.
Click Here to Read the Full Original Article at NewsBTC…


