What separates the advanced and novice traders during a bear market is the application of different strategies, preciseness, use of the common 3 triangle patterns, and managing trade to have a proper edge against other crypto traders. Trading without the proper skills, such as market structures of the crypto market and implementing your strategy, is akin to exposing yourself to risk, which could cost you your life, but in this case, your trading portfolio.
There is so much more involved in trading in the crypto space other than buying and selling based on the feeling that this is the best time to buy or sell an asset. Understanding the market is in phases or cycles gives the trader, investors, and institutions an advantage to trade with the necessary edge and the technical tools needed to produce a great return on investment (ROI) over time.
Let’s look at how most traders, investors, and institutions take advantage of 3 triangle patterns, especially in this bear market, to make profitable gains and stay ahead of the market and other traders.
What Is Triangle Pattern
The triangle pattern is a technical analysis chart formation used by traders to spot bullish continuations or reversals based on the market condition. This pattern comprises candlesticks formation enclosed in converging trendlines known as support and resistant lines. The two converging trendlines form a triangle, hence the pattern formation name.
These patterns are so useful to spot a bullish or bearish continuation of prices, and due to their high probability success rate, most traders use them during their trading.
There are 3 common types of triangle patterns ascending, descending, and symmetrical triangle patterns; let us discuss them with the help of the chart.
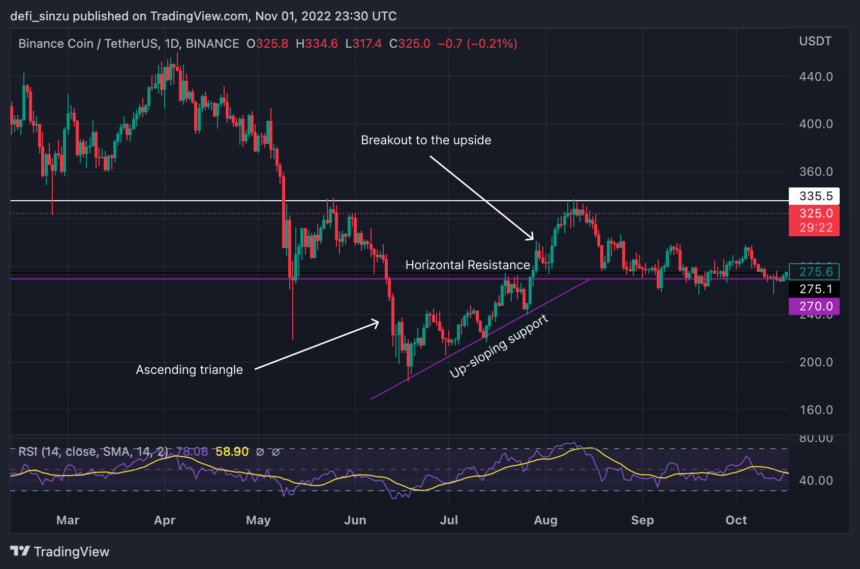
3 Triangle Patterns – Ascending Triangles
the ascending triangle is formed when there is a top acting as the resistance followed by an up-sloping bottom called the support. When the horizontal resistance line meets with the up-sloping support at the apex of the prices, there is a formation of an ascending triangle. Prices can breakout in either direction; this could be a breakout above the horizontal resistance or a breakdown below the up-sloping support leading to a bearish downtrend.
Descending Triangle
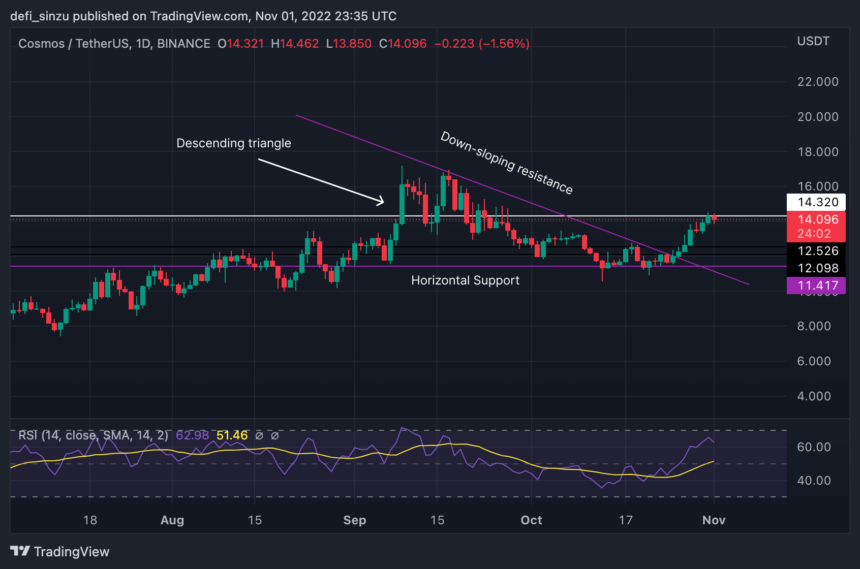
This triangle is mostly seen in the case of the downtrend in price as the…
Click Here to Read the Full Original Article at NewsBTC…


