Altcoin prices crumbled after the United States Securities and Exchange Commission (SEC) announced lawsuits against Binance and Coinbase at the start of the week. Apart from the action against the two biggest crypto exchanges, investors seem to be nervous because the SEC labeled 23 cryptocurrencies as securities in the two lawsuits. That brings the total number of cryptocurrencies termed as securities by the SEC to 67.
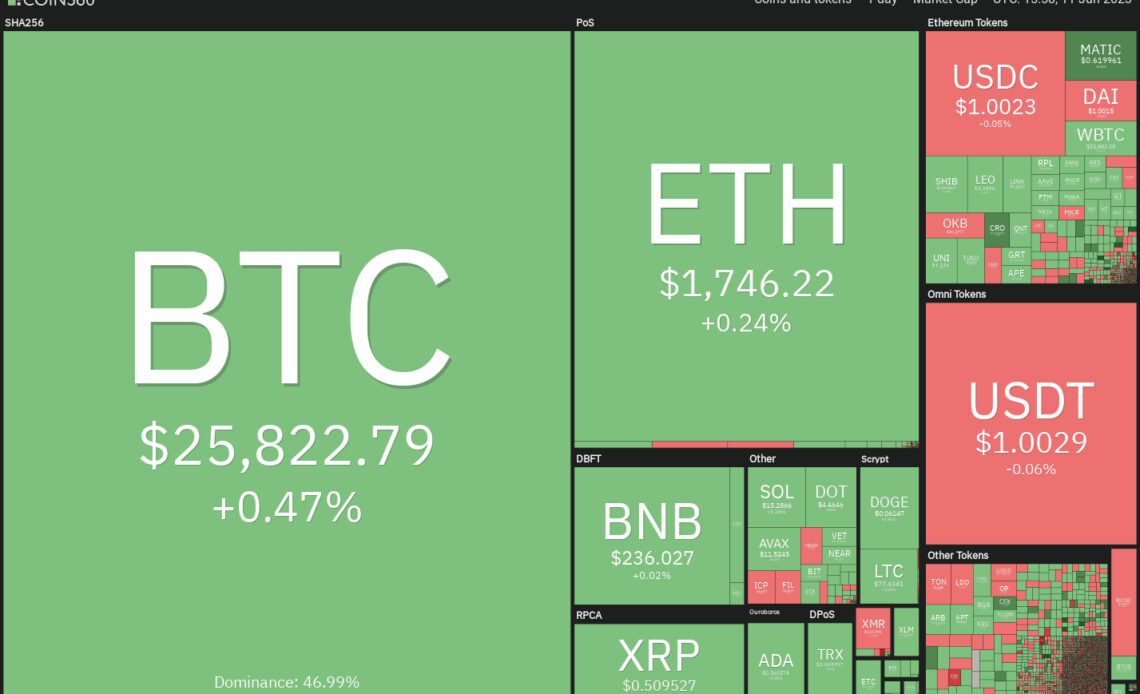
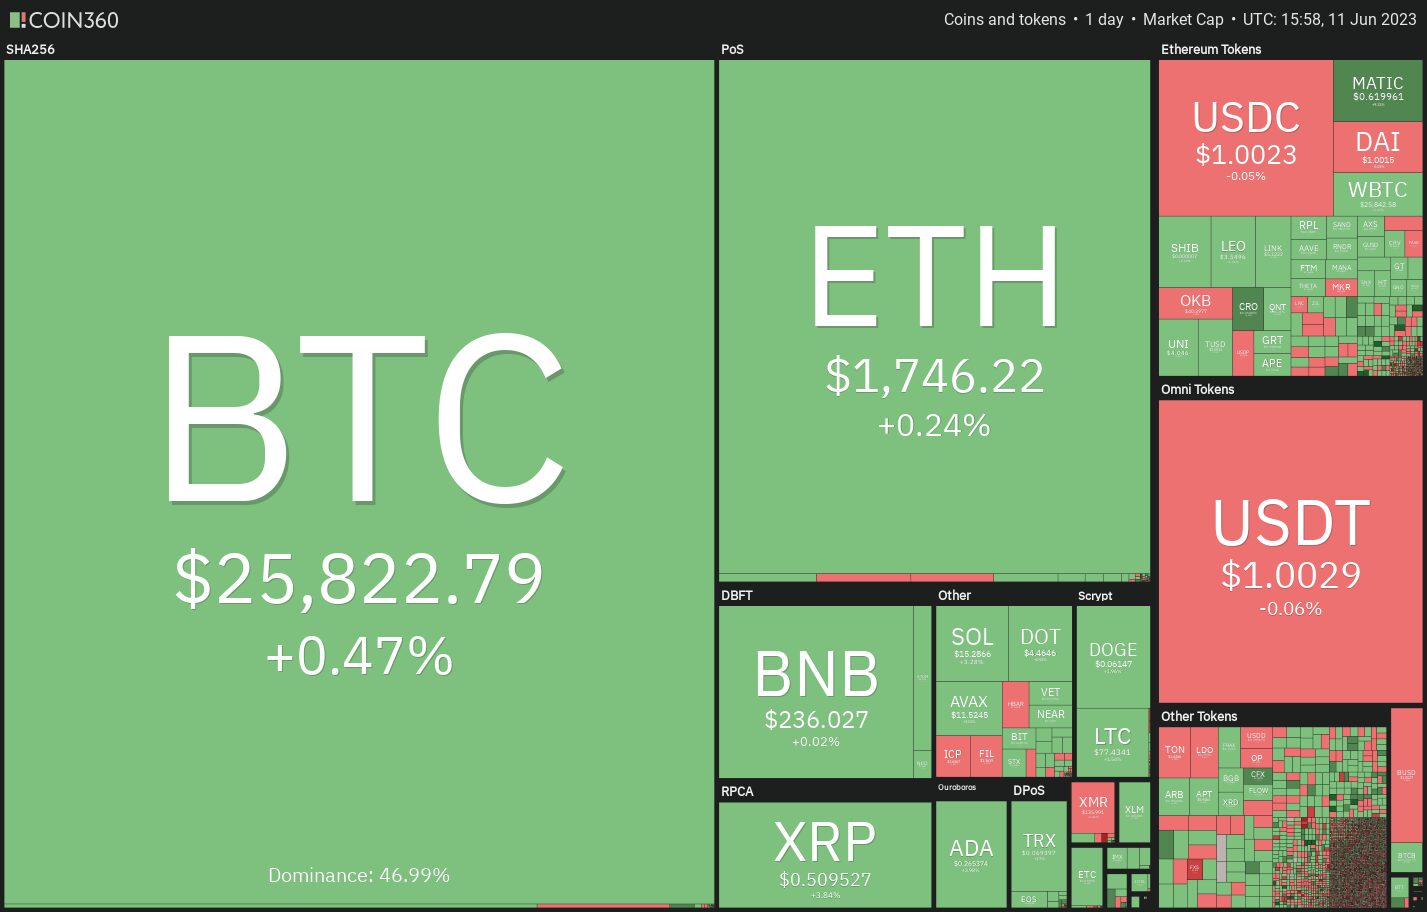
Among the mayhem, a minor positive is that Bitcoin (BTC) and Ether (ETH) have held out relatively well. This suggests that institutional investors are not panicking and dumping their positions. Due to their outperformance, Bitcoin’s dominance has risen to a year-to-date high of 47.6% and Ether’s to 20%.
The uncertainty in the near term is likely to keep several investors on the sidelines. During this period, the cryptocurrencies that have held out generally tend to do well when the market sentiment improves.
Let’s look at the top-5 cryptocurrencies that are trying to sustain above their respective support levels and are attempting to start a rebound. What are the important support and resistance levels to keep an eye on?
Bitcoin price analysis
Bitcoin once again dipped to the crucial support at $25,250 on June 10, indicating that the bears are keeping up the pressure. The repeated retest of a support level within short intervals tends to weaken it.
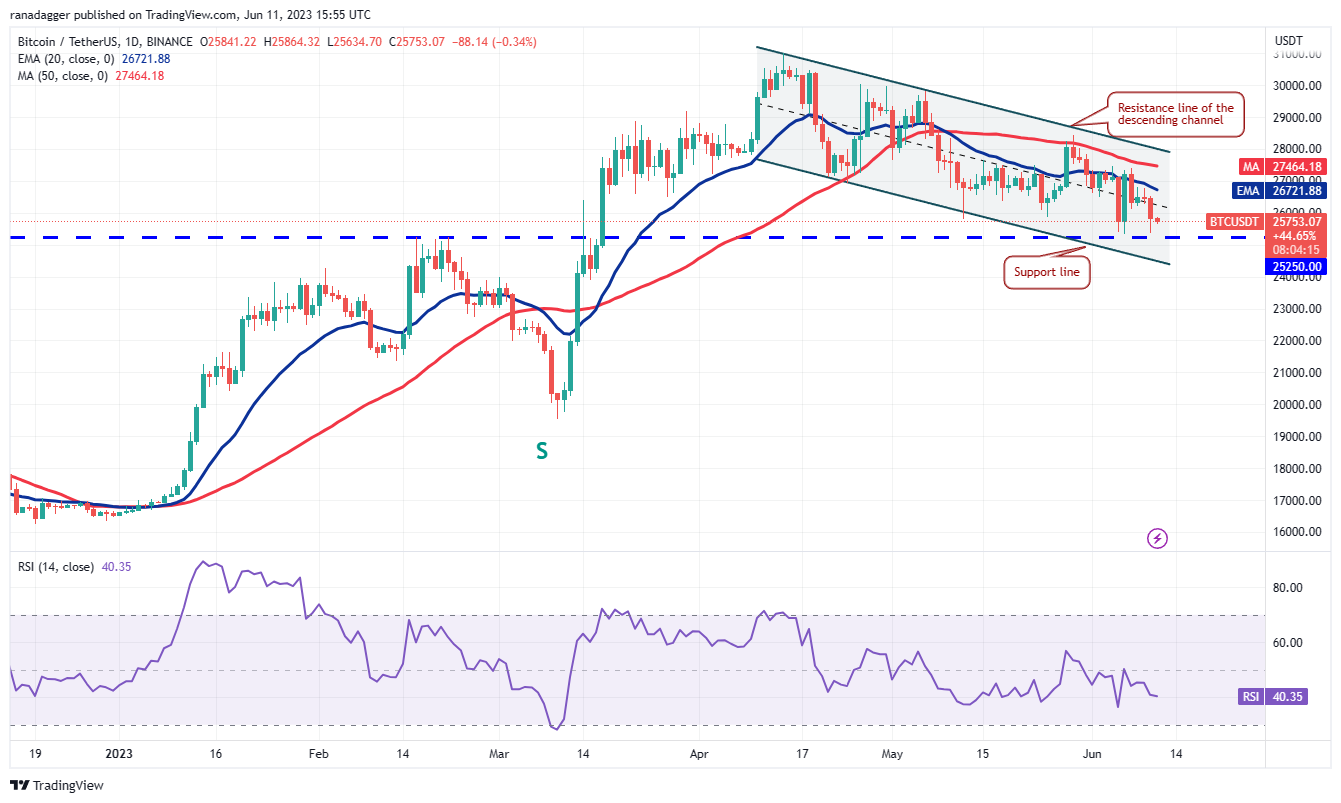
The downsloping moving averages and the relative strength index (RSI) in the negative territory indicate that bears are in control. If the support zone between $25,250 and $23,896 crumbles, the BTC/USDT pair may witness panic selling. The pair could then plummet to the psychologically vital level of $20,000. Buyers are expected to protect this level with all their might.
If bulls want to prevent a sharp decline, they will have to quickly push the price above the 20-day exponential moving average ($26,721). Such a move will suggest strong demand at lower levels. The pair may first rise to the 50-day simple moving average ($27,464) and thereafter to the resistance line of the channel. Buyers will have to kick the price above this level to indicate the resumption of the up-move.
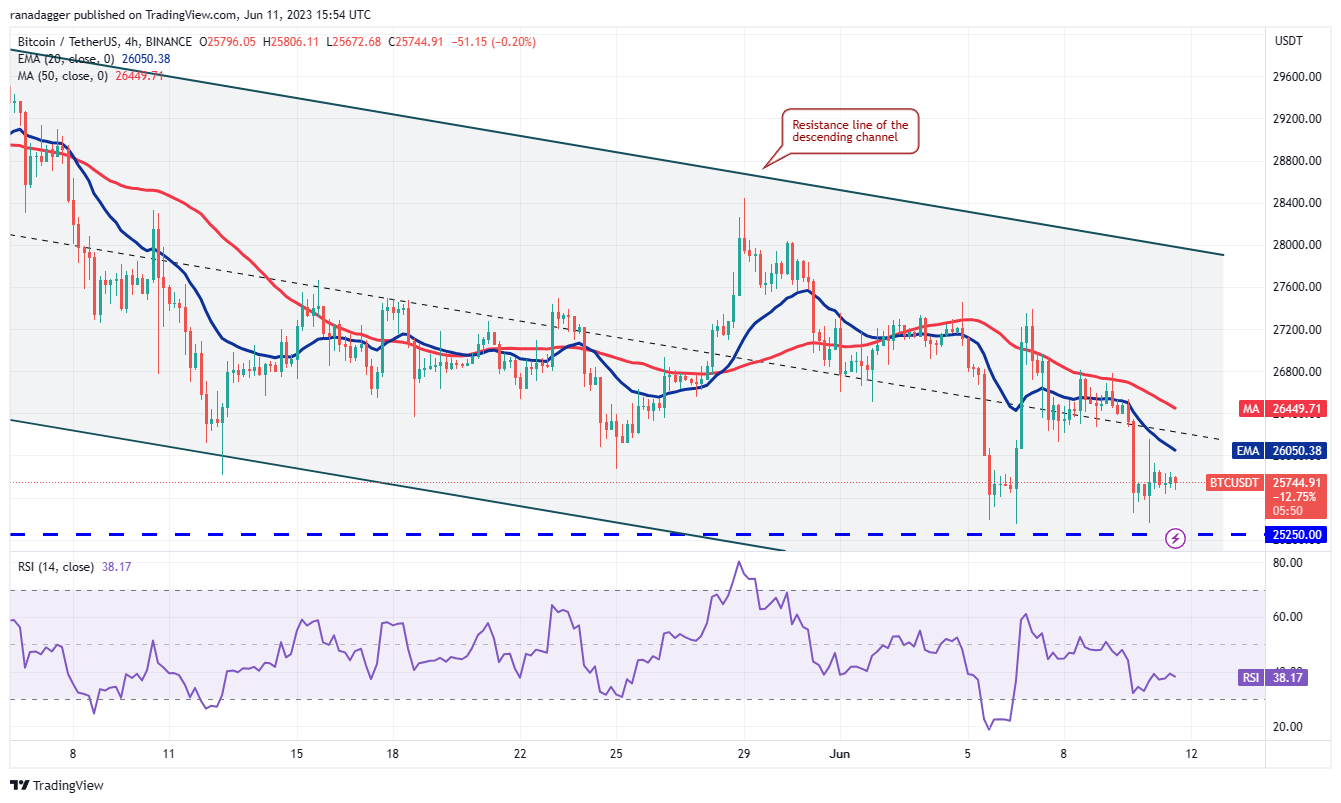
The 4-hour chart shows that the recovery off the $25,250 support is facing selling at the 20-EMA. This indicates that the bears are not giving any opportunity to the bulls to make a comeback. The…
Click Here to Read the Full Original Article at Cointelegraph.com News…


