Bitcoin (BTC) has been consolidating above $35,000 for several days, but the bulls have failed to resume the uptrend above $38,000. This suggests hesitation to buy at higher levels. BitGo CEO Mike Belshe said in a recent interview with Bloomberg that there is likely to be another round of rejections of the spot Bitcoin exchange-traded fund applications before they are finally approved.
Multiple analysts believe Bitcoin will enter a correction in the near term, with the worst outcome projecting a drop to $30,000. However, the fall is unlikely to start a bear phase. Look Into Bitcoin creator Philip Swift said that on-chain data suggests that the Bitcoin bull market is still in its early stages as there is “no FOMO yet.”
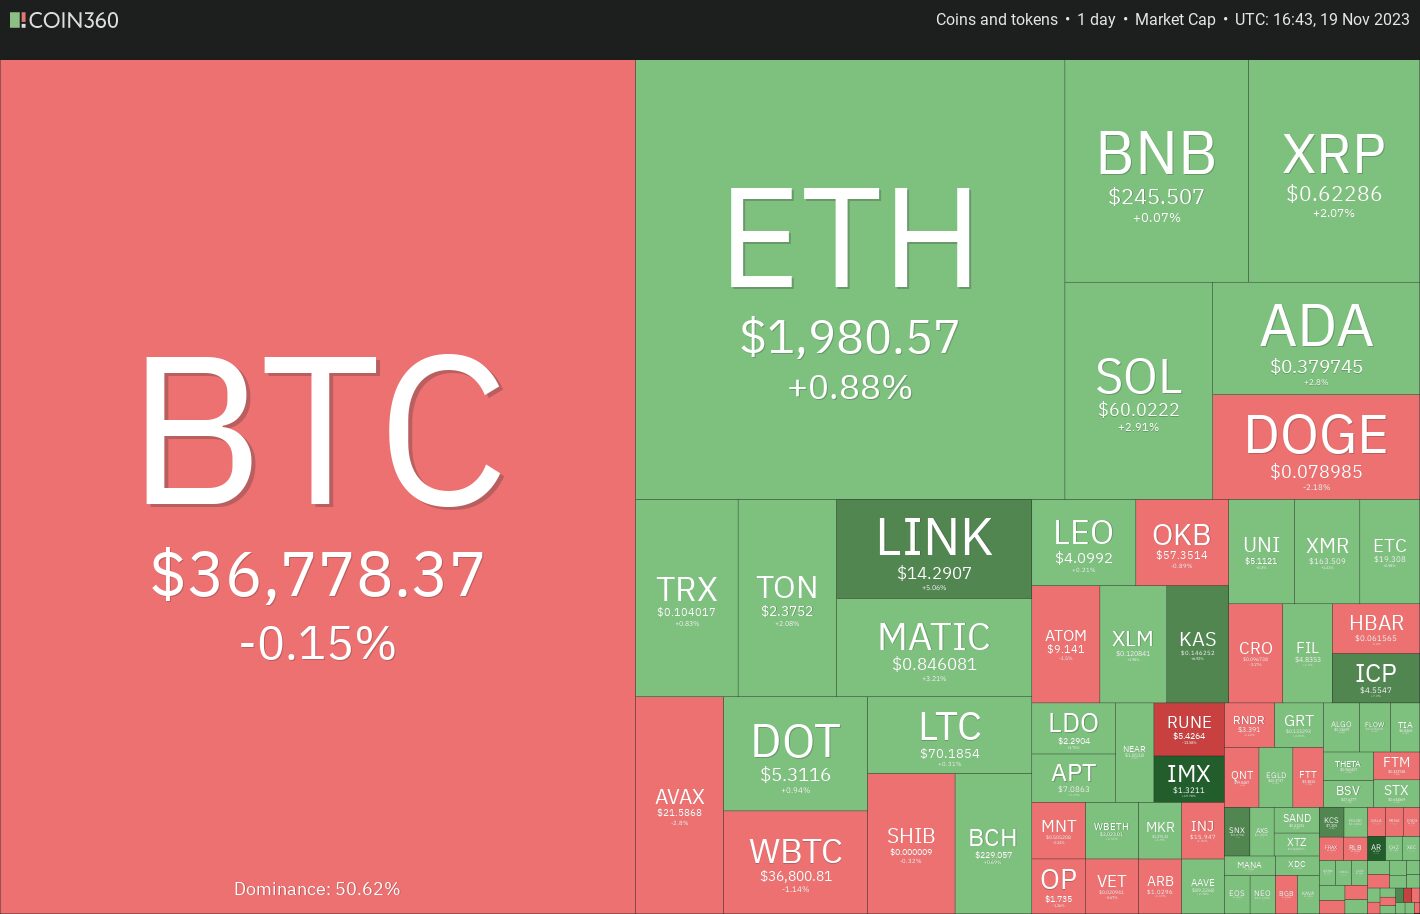
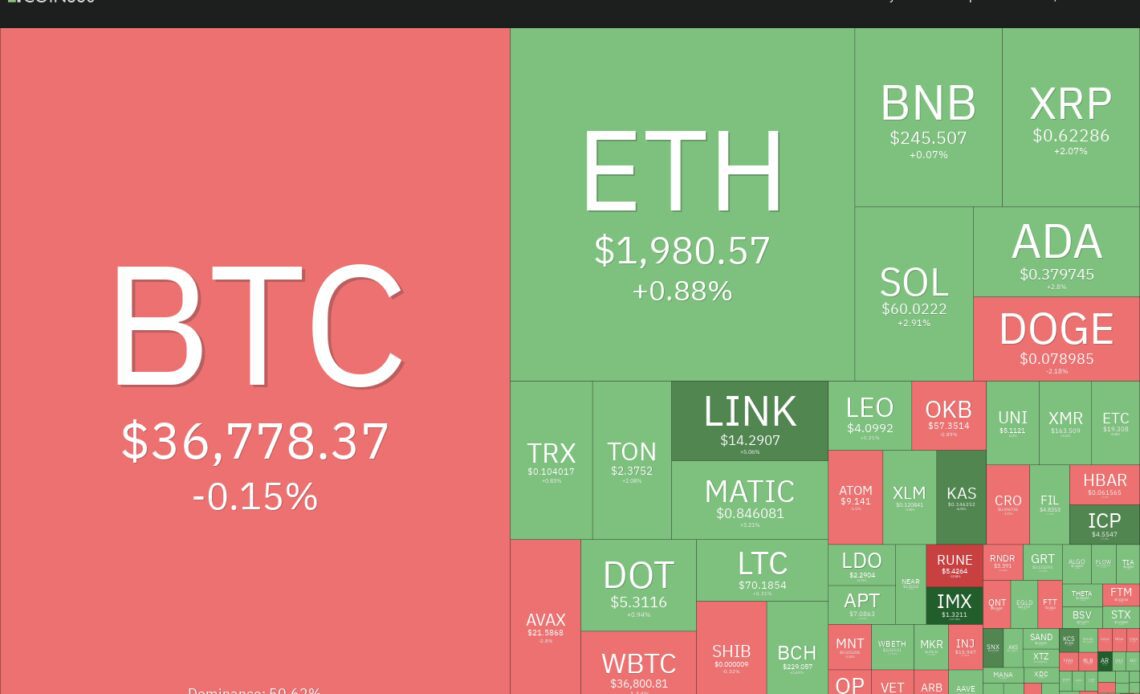
As Bitcoin takes a breather, several altcoins have witnessed a pullback, but some are showing signs of resuming their uptrends. Fidelity and BlackRock’s applications filed for a spot Ether ETF show strong demand for investment in select altcoins.
Could Bitcoin stay above $35,000 over the next few days? Is it time for altcoins to start the next leg of their up-move? Let’s look at the charts of the top 5 cryptocurrencies that may rise in the short term.
Bitcoin price analysis
Bitcoin is facing stiff resistance near $38,000, but a positive sign is that the bulls have not allowed the price to dip below the 20-day exponential moving average ($35,666).
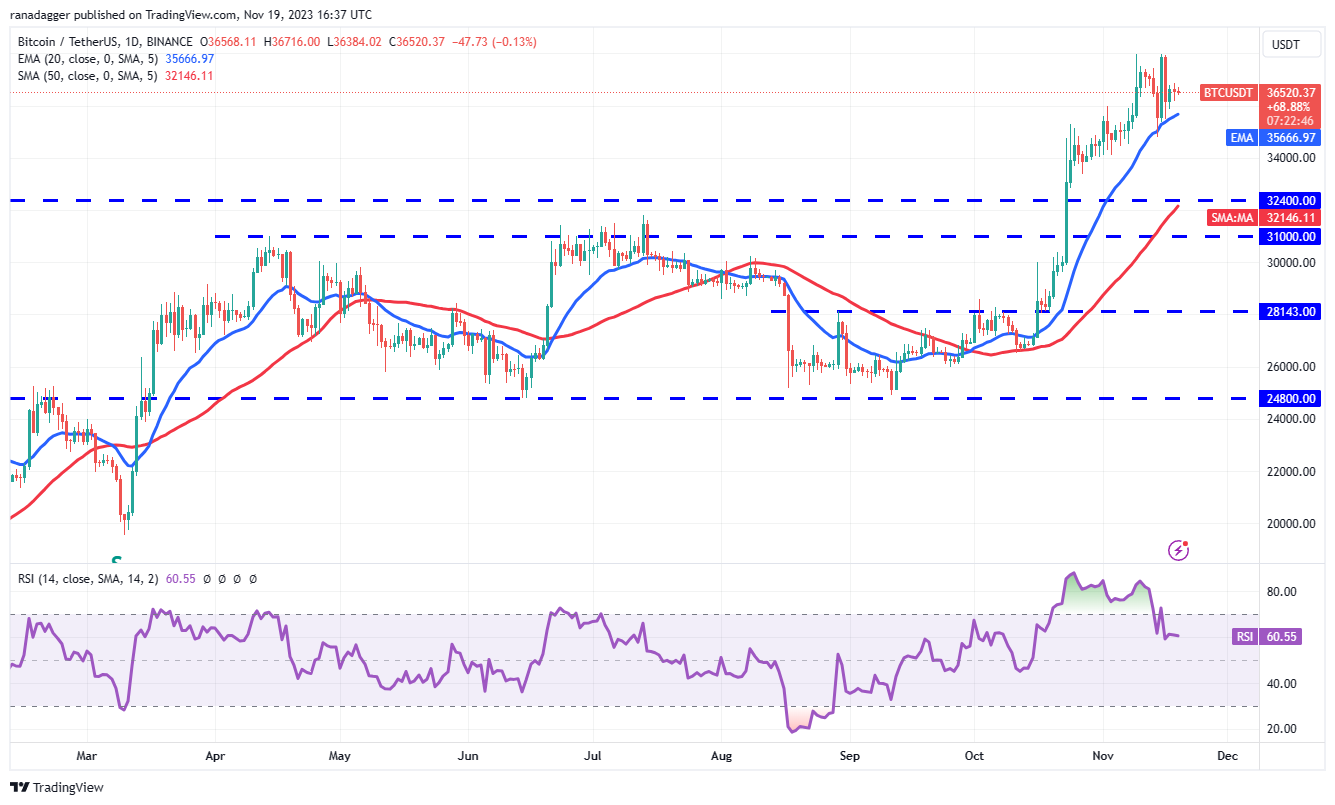
The upsloping moving averages and the relative strength index (RSI) in the positive zone indicate that bulls have the upper hand. If the price rebounds off the 20-day EMA, the bulls will make one more attempt to overcome the roadblock at $38,000.
If they succeed, the BTC/USDT pair may reach $40,000. This level may witness aggressive selling by the bears, but if buyers bulldoze their way through, the rally could eventually touch $48,000.
The first sign of weakness will be a close below the 20-day EMA. That will indicate the possibility of a range-bound action in the near term. The pair may remain stuck between $34,800 and $38,000 for a while. A break below $34,800 could clear the path for a decline to $32,400.
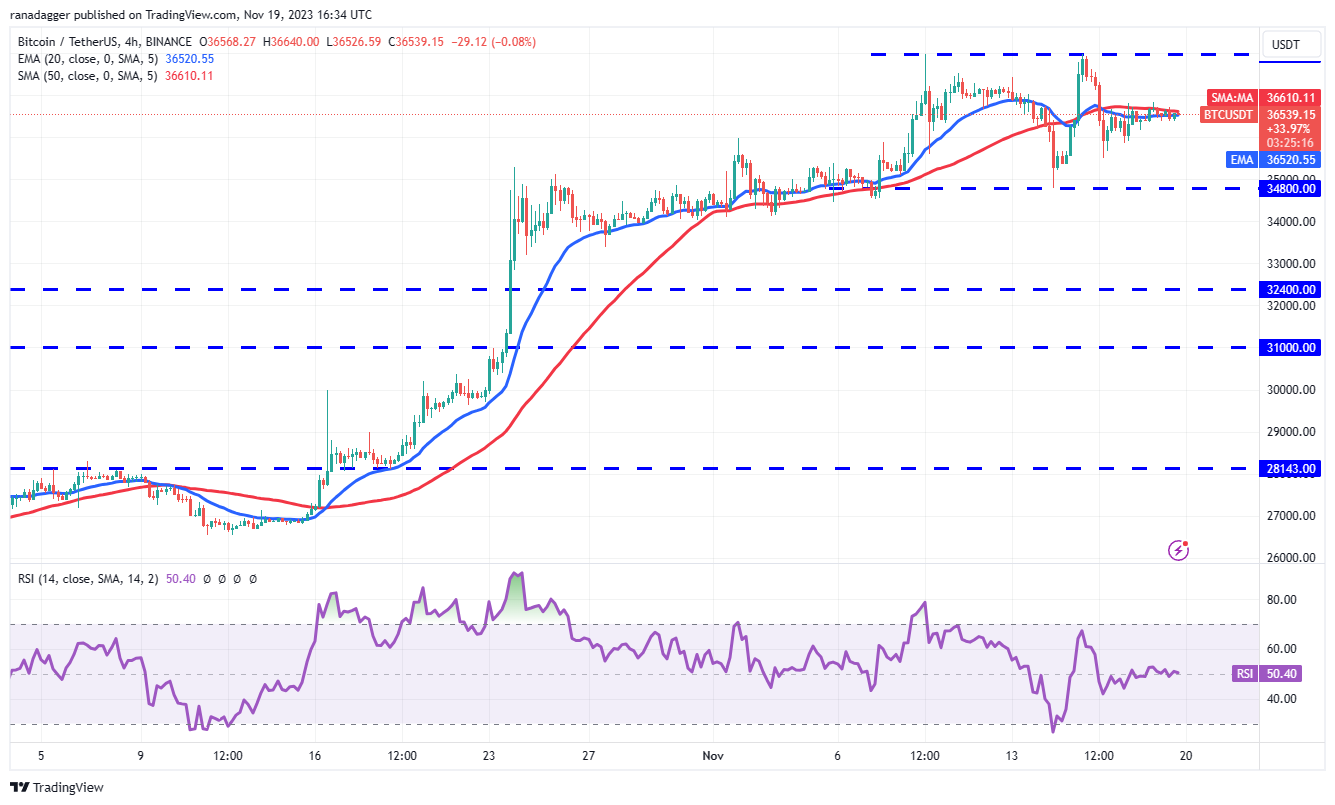
The 4-hour chart shows that the price is swinging between $38,000 and $34,800. Both moving averages have flattened out, and the RSI is near the midpoint, indicating that the range-bound action may continue for some more time.
A tight consolidation near the 52-week…
Click Here to Read the Full Original Article at Cointelegraph.com News…


