The XRP price has entered what is regarded as the Dollar Cost Averaging (DCA) ranging zone, according to crypto analyst Egrag. While the digital asset’s price oscillates within a critical zone, the analyst maintains a bullish stance on its future trajectory.
XRP Price Enters DCA Zone
Egrag stated via a post on X, “XRP Color Code (Update): My Stance Forged in the Fires of Conviction: Let me say it 1 million times that I’m still bullish AF, so ease up on the DMs assuming I’ve switched my stance. Remember, markets move in waves, and I’m here to present the short-term moves because, let’s face it, 80% want to reach Valhalla without dying.”
The analyst’s latest technical analysis reveals that the previous support level at $0.66 proved to be weaker than anticipated, leading to a shift in the XRP price’s movement into a ranging zone. “$0.66 wasn’t a solid support, as I’ve mentioned before. XRP is in the ‘ranging’ zone, so the DCA opportunity is open,” Egrag stated.
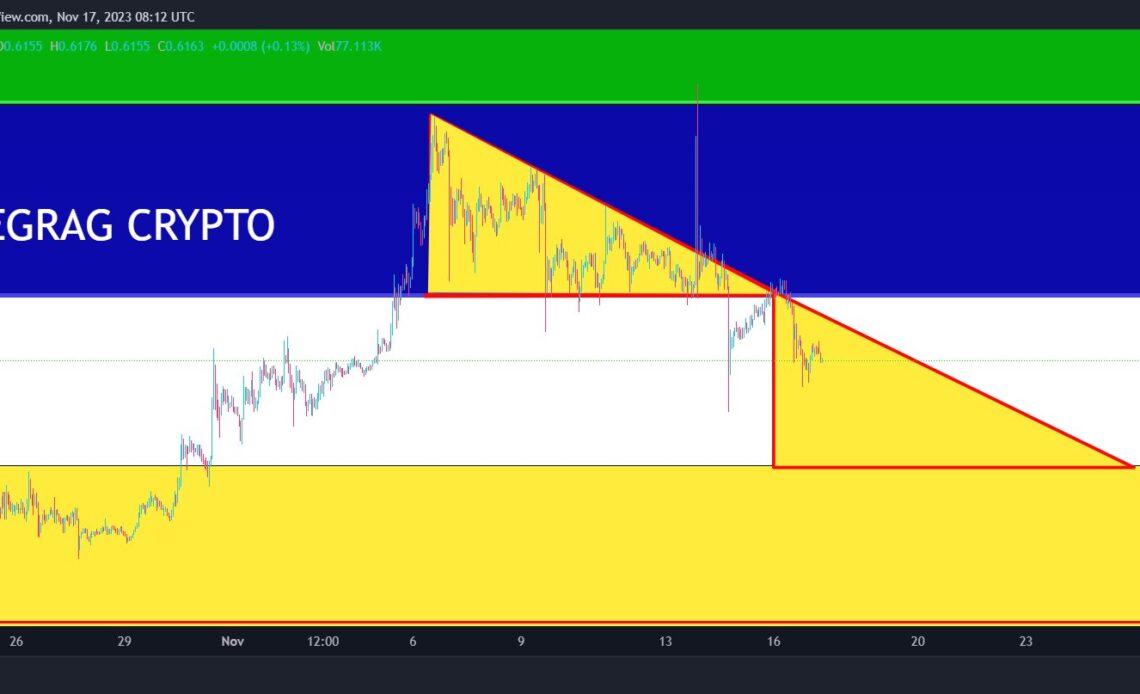
The analyst’s chart exhibits a descending triangle pattern breaking downwards, indicating potential bearishness in the short term. However, Egrag highlights the importance of the $0.50 mark as a “robust support.” He asserts that the price “won’t dip below $0.50—it’s a pivotal price point.”
The above 1-hour chart shows that the price has now been rejected several times at the falling (red) trend line. If this momentum is maintained, XRP could drop further and could find first support near $0.57. If this support also breaks, the $0.51 mark could be the most crucial turning point.
For Egrag, the zone between $0.5738 and $0.5119 is the “wicking” zone, meaning that the price could swiftly dip into this zone. However, if the price drops below $0.5119, it would enter the “red flag” zone of Egrag’s chart, potentially invalidating the entire prediction.
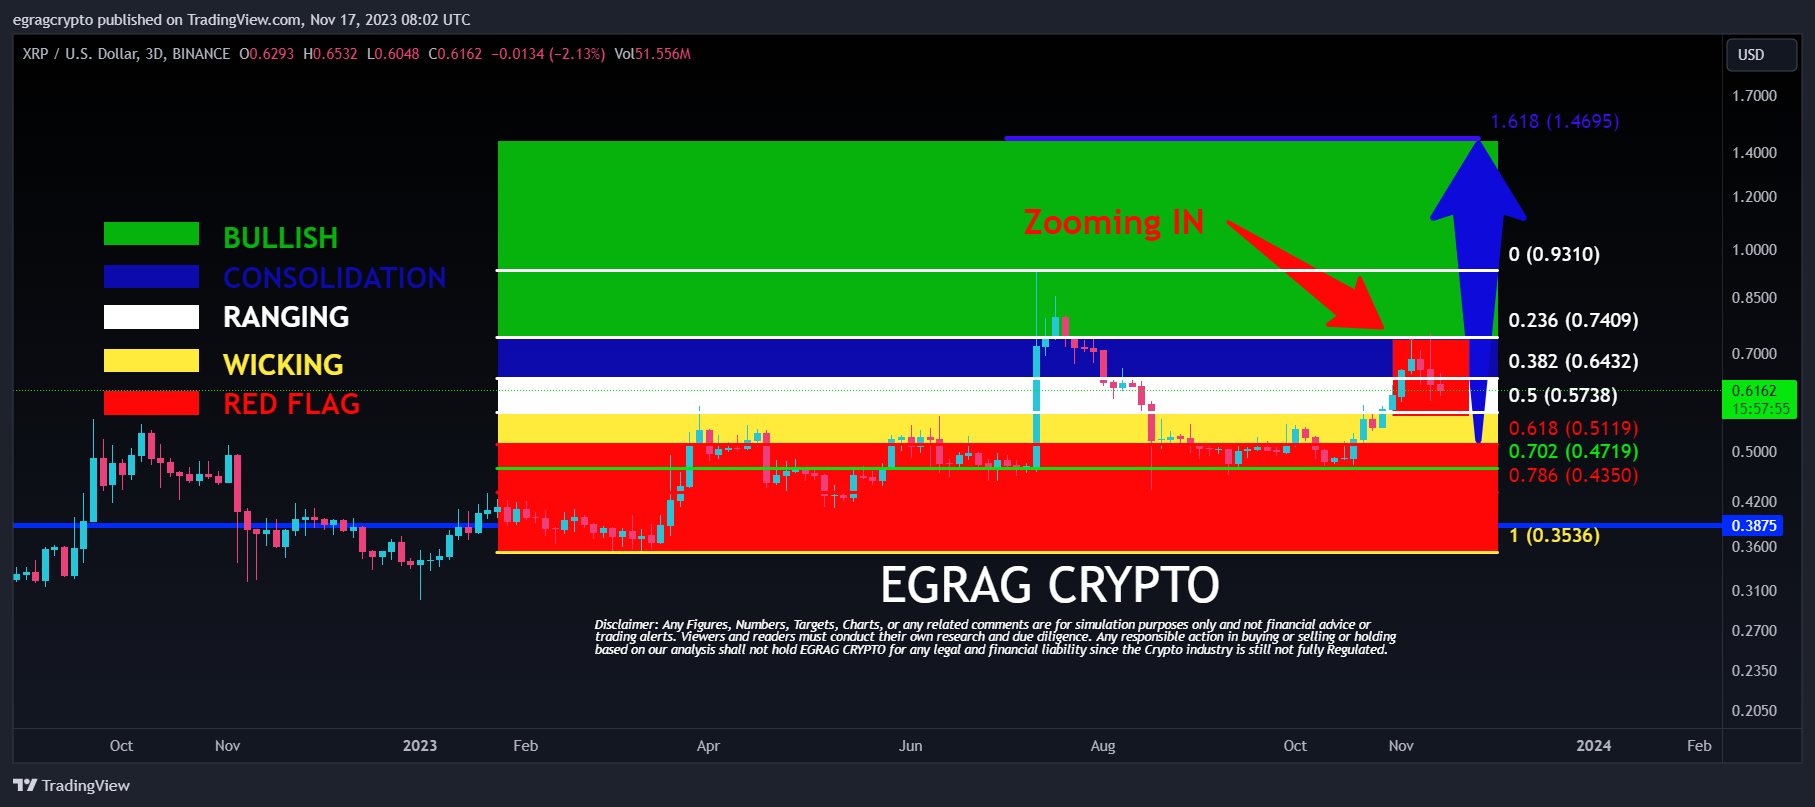
The Fibonacci retracement levels on Egrag’s 3-day chart suggest significant resistance and support zones. The 0.236 level at approximately $0.7409 and the 0.382 level at about $0.6432 may act as resistance in a bullish scenario, while the 0.5 level at $0.5738 and the 0.618 level at $0.5119 could provide support if bearish momentum continues.
Notably, Egrag’s commentary doesn’t shy away from conviction, “XRP is transforming the way value moves in this digital age. So, it’s…
Click Here to Read the Full Original Article at NewsBTC…


