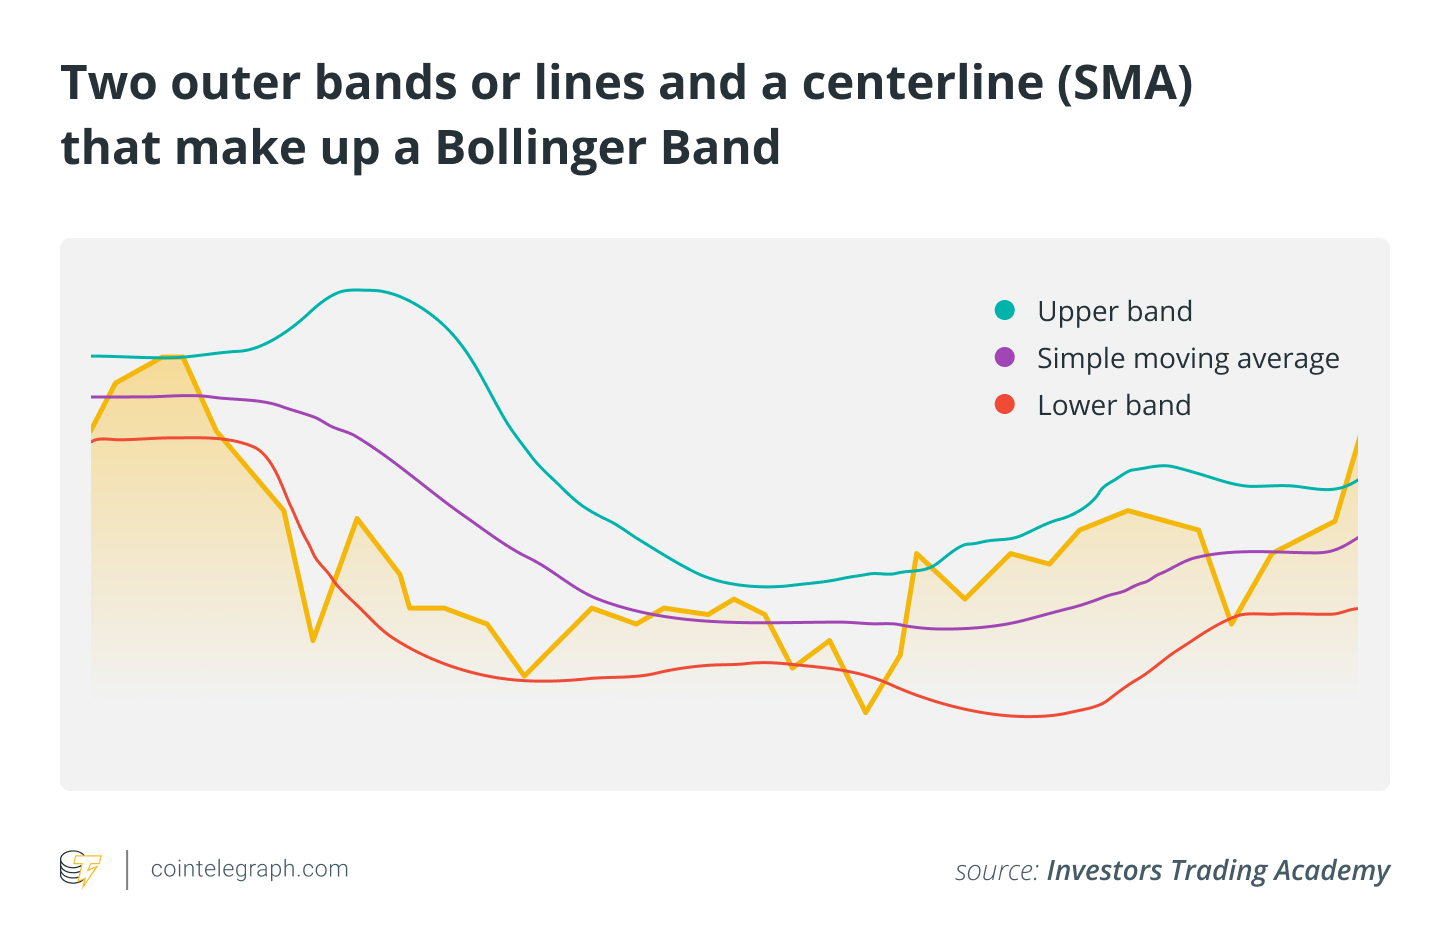
A technical analysis tool called Bollinger Bands uses price volatility to provide probable entry and exit opportunities in trading. They are made up of two outer bands or lines and a centerline (the simple moving average for a 20-day period), which enlarges and contracts in response to changes in price. For thorough market analysis, they are frequently utilized in conjunction with other technical indicators.
Bollinger Bands, explained
Bollinger Bands were created by John Bollinger in the 1980s. They are a useful technical analysis tool used in cryptocurrency trading and other financial markets to evaluate price volatility, pinpoint probable reversal points, and make trading decisions.
The three bands that help construct a Bollinger Band include:
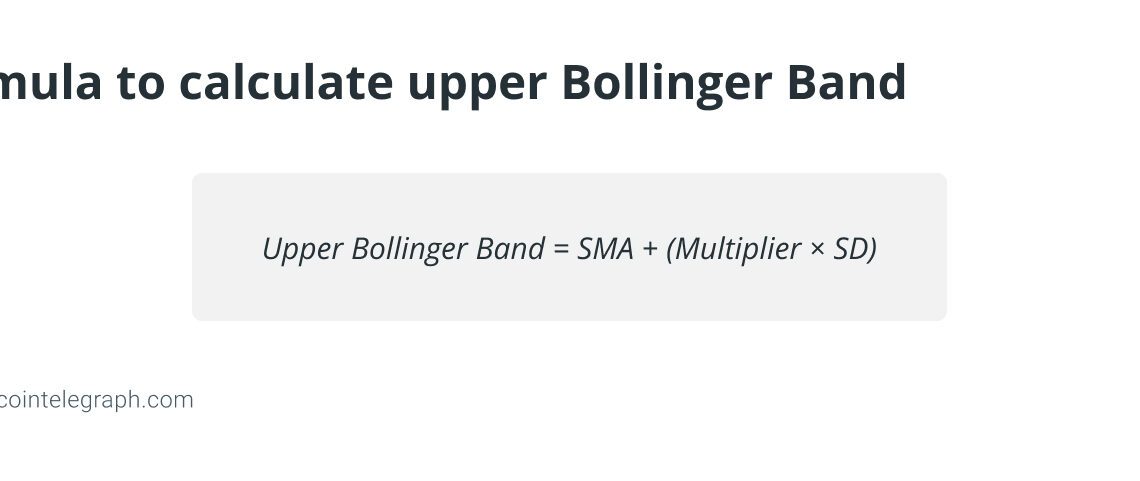
Upper band
The upper band is created by multiplying the middle band by the price’s standard deviation. A price’s volatility is quantified by the standard deviation. Traders often use a multiplier of 2 for the standard deviation (SD), but this can be changed depending on the state of the market and personal preferences.
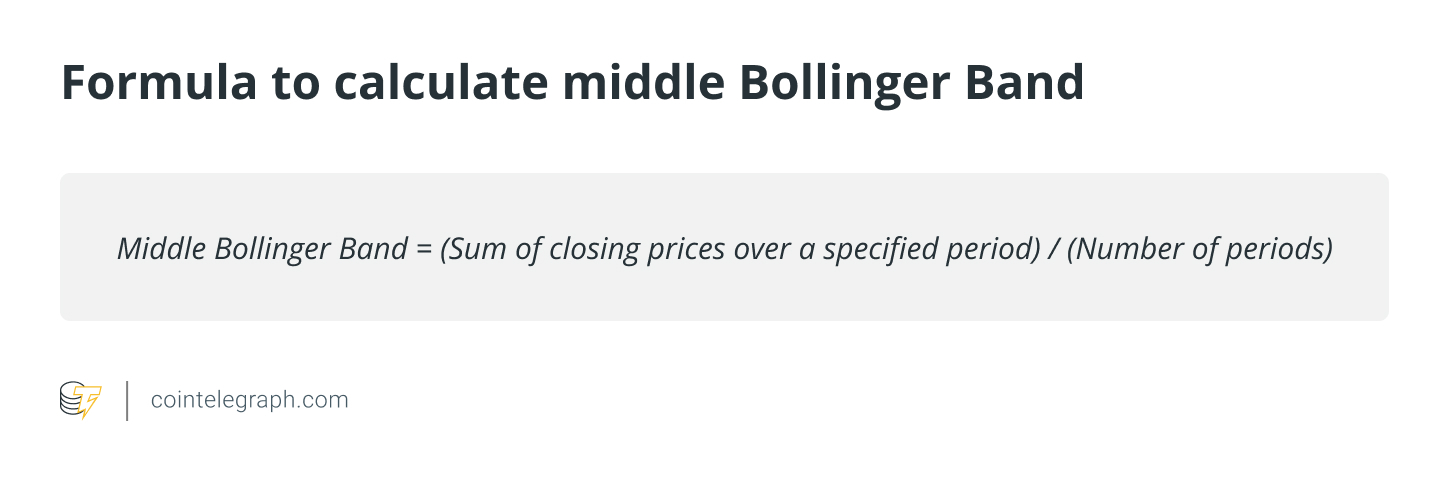
Middle band (SMA)
The middle band typically represents the price of the asset over a given period as a simple moving average (SMA). It serves as the axis and depicts the average price of the cryptocurrency within the selected time frame.
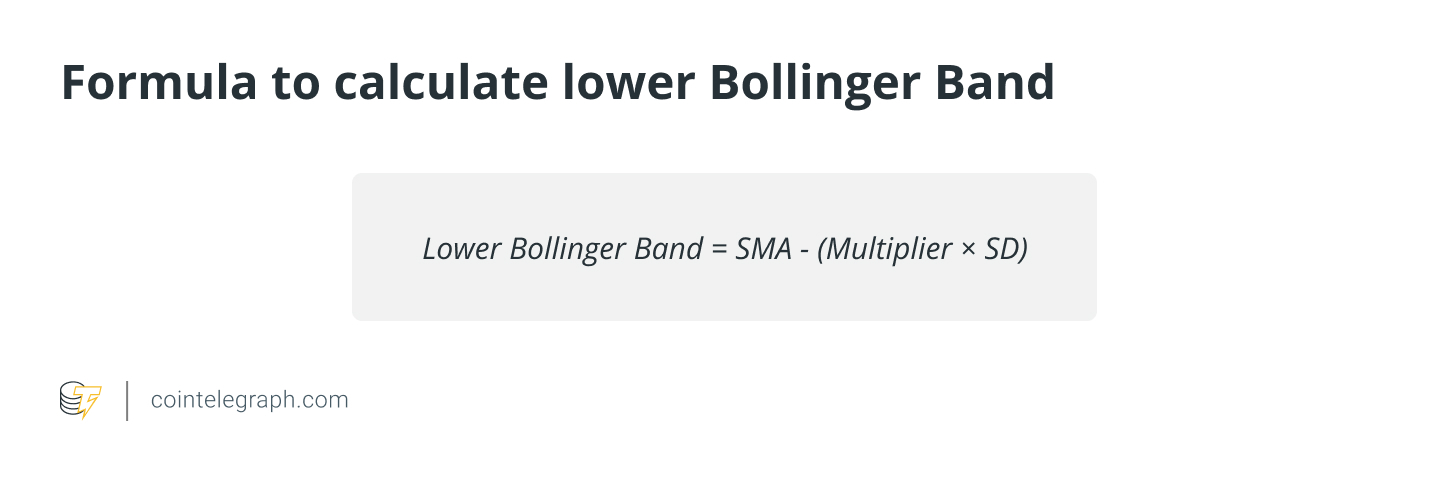
Lower band
From the middle band, a multiple of the standard deviation is subtracted to determine the lower band.
The purpose of Bollinger Bands in cryptocurrency trading
In cryptocurrency trading, Bollinger Bands serve as a crucial technical analysis technique that allows traders to:
Assess price volatility
Traders can assess the degree of price volatility in the cryptocurrency market using Bollinger Bands. When the bands widen, there may be trading possibilities because it suggests higher volatility. On the other hand, a contraction of the bands denotes less volatility and the potential for price consolidation or trend reversals.
Identify overbought and oversold conditions
Bollinger Bands are used to detect possible overbought and oversold scenarios, helping traders identify them. A potential sell opportunity arises when the price reaches or exceeds the upper band, which is a sign that the price is overbought. On the other hand, if the price reaches or drops beneath the lower band, it can be considered oversold, indicating a potential purchase opportunity.
Determine trend direction
Traders may use Bollinger Bands to ascertain the prevailing trend direction. The price may…
Click Here to Read the Full Original Article at Cointelegraph.com News…


