Bear markets have historically been challenging to navigate for traders and the conventional set of “reliable” indicators that determine good entry points are unable to predict how long a crypto winter might last.
Bitcoin’s (BTC) recent recovery back above the psychologically important price level of $20,000 was a sign to many traders that the bottom was in, but a deeper dive into the data suggests that the short-term relief rally might not be enough proof of a macro-level trend change.
Evidence pointing to the need for caution was provided in a recent report by cryptocurrency research firm Delphi Digital, which suggested that “we need to see a little more pain before we have conviction that a market bottom is in.”
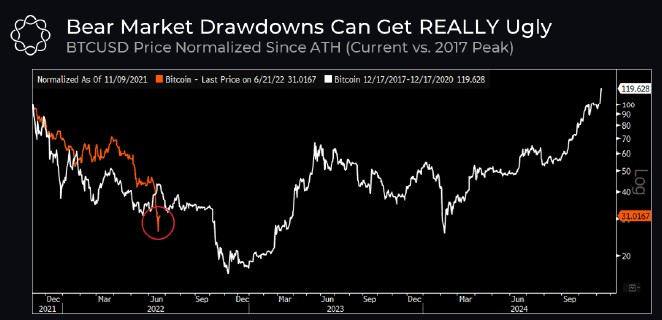
Despite the pain that has already been felt since Bitcoin’s price topped in November, a comparison between its pullback since then and the 2017 market top points to the possibility of further decline in the short-term.
During previous bear markets, the price of BTC fell by roughly 85% from its top to the eventual bottom. According to Delphi Digital, if history were to repeat itself in the current environment it would translate into “a low just above $10,000 and another 50% drawdown for current levels.”
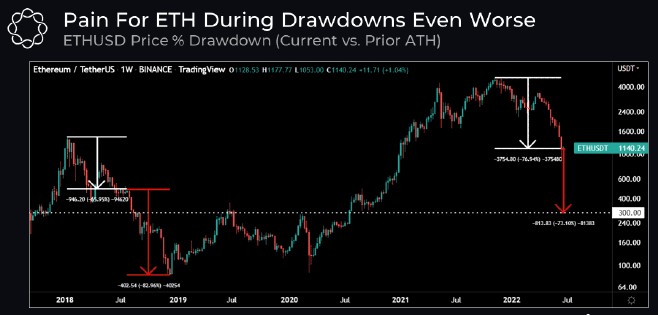
The outlook for Ether (ETH) is even more dire as the previous bear market saw its price decline by 95% from peak to trough. Should that same scenario play out this time around, the price of Ether could drop as low as $300.
Delphi Digital said,
“The risk of reliving a similar crash is higher than most people are probably discounting, especially if BTC fails to hold support in the $14-16K range.”
Oversold conditions prevail
For traders looking for where the bottom is in the current market, data shows that “previous major market bottoms coincided with extreme oversold conditions.”
As shown in the weekly chart below, BTC’s 14-week RSI recently fell below 30 for the third time in its history, with the two previous occurrences coming near a market bottom.
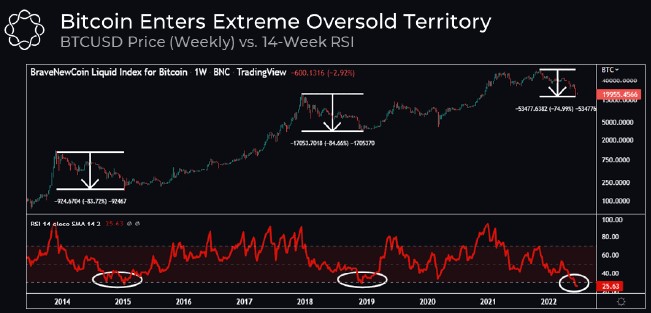
While some may take this as a sign that now is a good time to reenter the market, Delphi Digital offered a word of caution for those expecting a “V-shaped” recovery, noting that “In the prior two instances, BTC traded in a choppy sideways range for…
Click Here to Read the Full Original Article at Cointelegraph.com News…


