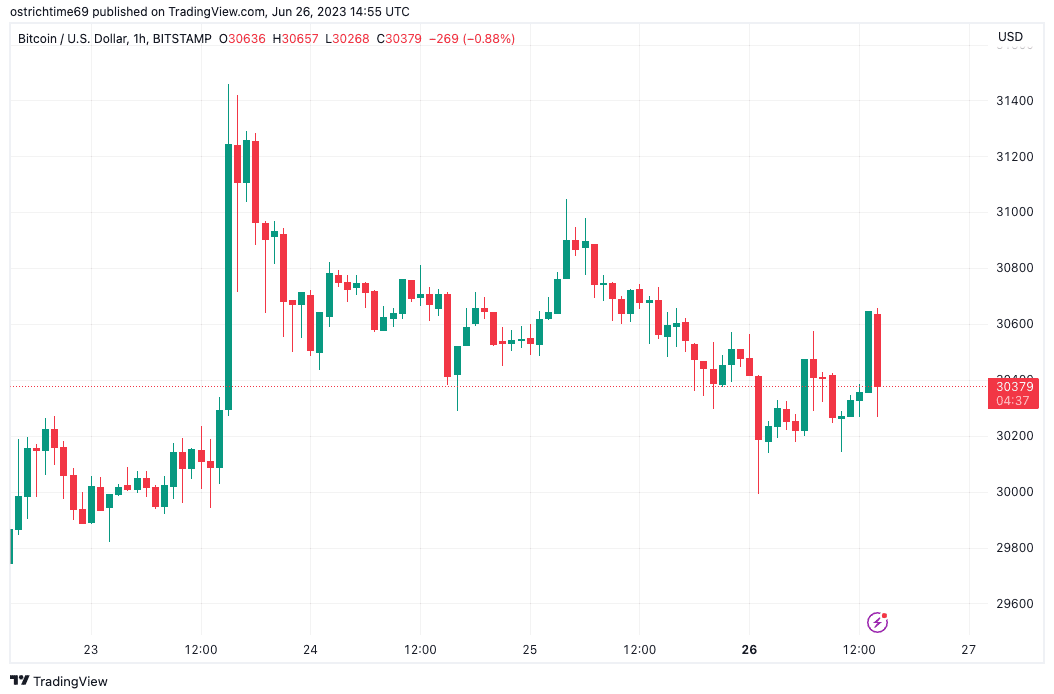
Bitcoin (BTC) circled $30,500 at the June 26 Wall Street open as bulls held newfound support.
Bitcoin ETF hype puts demands on U.S. session
Data from Cointelegraph Markets Pro and TradingView showed BTC price action retaining $30,000 around the weekly close.
The largest cryptocurrency began the week on a stable note as U.S. markets began trading, with observers hoping for a copycat move from the week prior.
Then, the United States provided the lion’s share of buyer interest, following multiple announcements of institutional product applications based on the Bitcoin spot price.
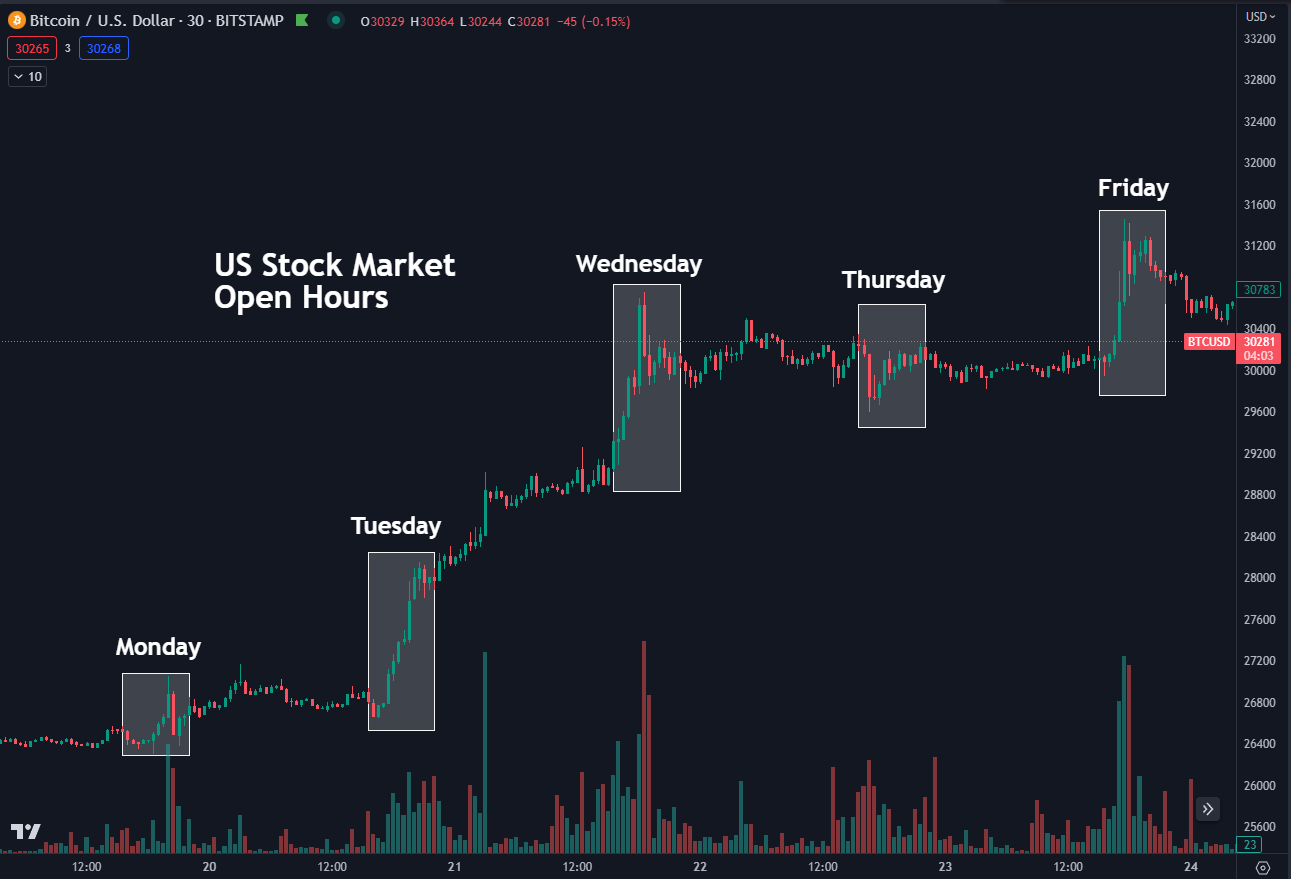
“Last week, most action and buying pressure, happened during the US Stock Market Open Hours,” popular trader Daan Crypto Trades noted on the day.
Fellow trader Skew agreed, calling the June 26 U.S. trading session “important.”
$BTC Aggregate CVDs & Delta
Spot buying led the bounce into the weekly open ($30,447) ; some perp hedging seen here (Perp CVD lower compared to price / Spot CVD)US session going to be more important (has driven price direction persistently recently) pic.twitter.com/mfzfSnx5OB
— Skew Δ (@52kskew) June 26, 2023
On-chain analytics firm Glassnode confirmed the trend, suggesting that it could form part of a more long-term shift thanks to the U.S. exchange-traded fund (ETF) filings.
“As a gold rush of institutional-grade ETF applications are filed in the US, we have seen early signs of a revival of US-led demand,” it wrote in the latest edition of its weekly newsletter, “The Week On-Chain.”
“This comes after a period of weaker relative US demand in 2023, with top exchanges in Asia seeing the strongest accumulation year to date.”
Analyst: Snap BTC price correction “highly unlikely”
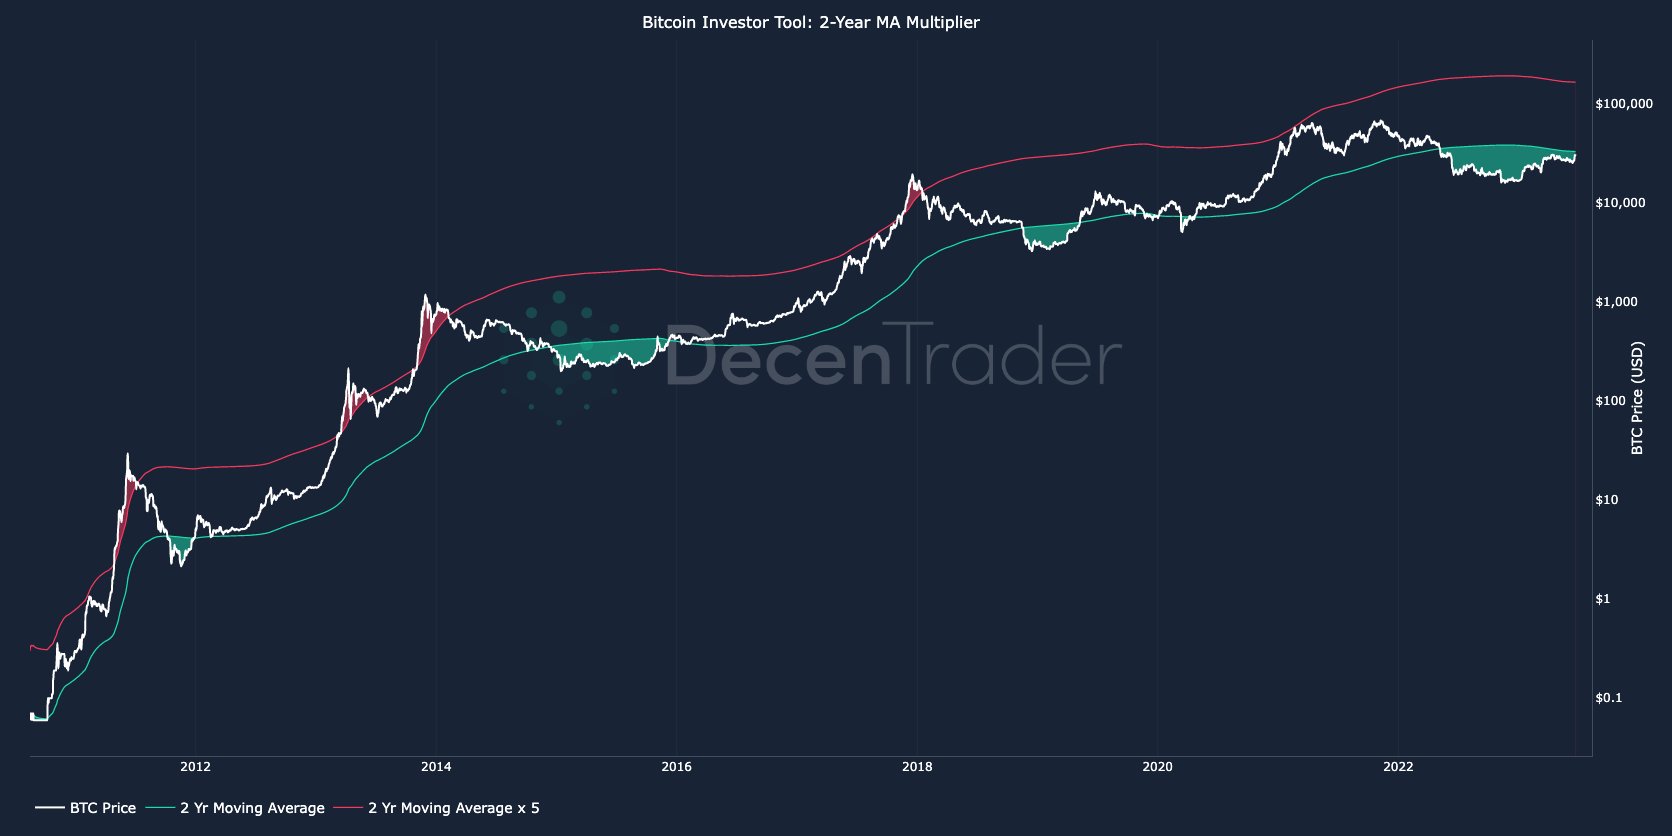
Turning to BTC price performance itself, trading suite DecenTrader flagged a key resistance level now overhead.
Related: BTC price up, fundamentals down? 5 things to know in Bitcoin this week
This came in the form of its two-year moving average (MA) at just above $32,800.
“Historically, underneath the 2 Year MA has provided a fantastic accumulation opportunity ahead of the following halving cycle,” part of Twitter analysis stated.
An accompanying chart showed the two-year MA plus the trend line reflecting five times its value, suggesting upside follows breakouts above the former.
Shorter…
Click Here to Read the Full Original Article at Cointelegraph.com News…


