The Avalanche (AVAX) price has been undetermined for quite a number of weeks now. The altcoin is now logging gains on the daily chart as it rose over 3% in that time frame. The coin shows signs of optimism ever since it moved up from the $12.90 support mark.
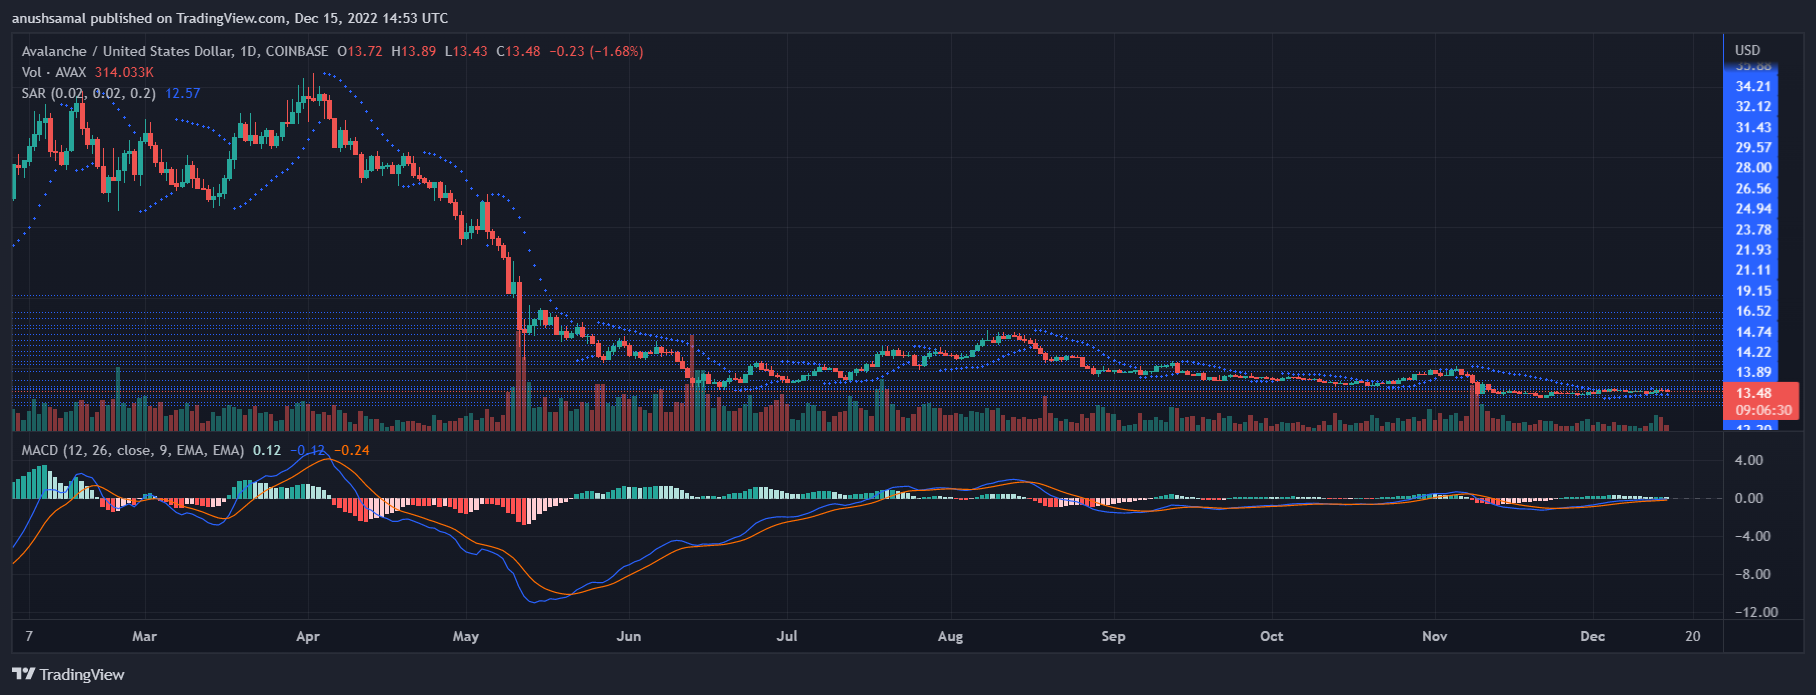
The technical outlook for AVAX displayed signs of demand and buy signals for traders. If demand continues to rise and buying sentiment increases over the immediate trading sessions, the chance of AVAX piercing through other resistance levels will strengthen further.
As the coin continues to secure higher highs and higher lows, the bulls still remain in charge of the asset. However, if AVAX starts to consolidate below the $13 price level, then the altcoin can register depreciation.
Progressive price momentum demands AVAX breach the $14.30 resistance mark. Once AVAX successfully manages to challenge that level, the bulls will stick around for longer. The market capitalisation of the altcoin already registered an upsurge which is tied to an increase in accumulation.
Avalanche Price Analysis: One-Day Chart
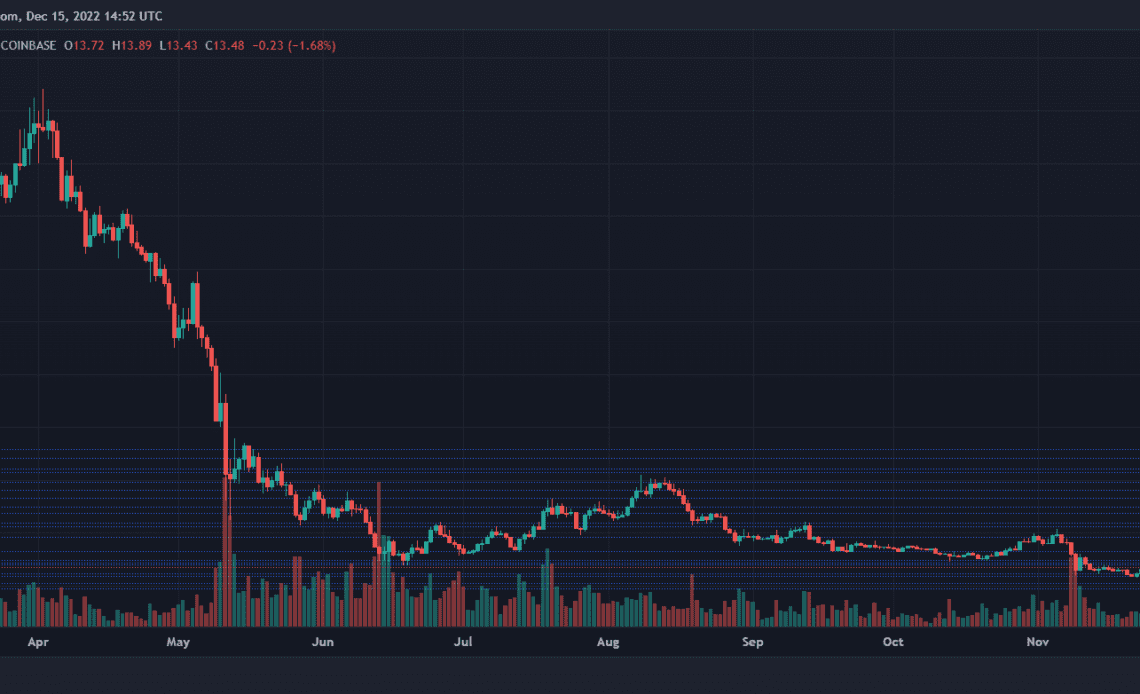
The immediate overhead price ceiling that Avalanche price needs to breach stood at $13.90. This move would ensure another rally to $14.60. Once the coin moves past that level, accumulation will increase considerably.
Traders had ample entry points in the market; for instance when AVAX dipped to $12. Over the upcoming trading sessions, investors can manage to see returns on the chart.
On the other hand, if due to lack of demand AVAX starts to consolidate, the next level for the coin would be at $12.20 and then to $11. This would mean an 18% fall in price for AVAX.
AVAX was trading at $13.48 at the time of writing.
AVAX Technical Analysis

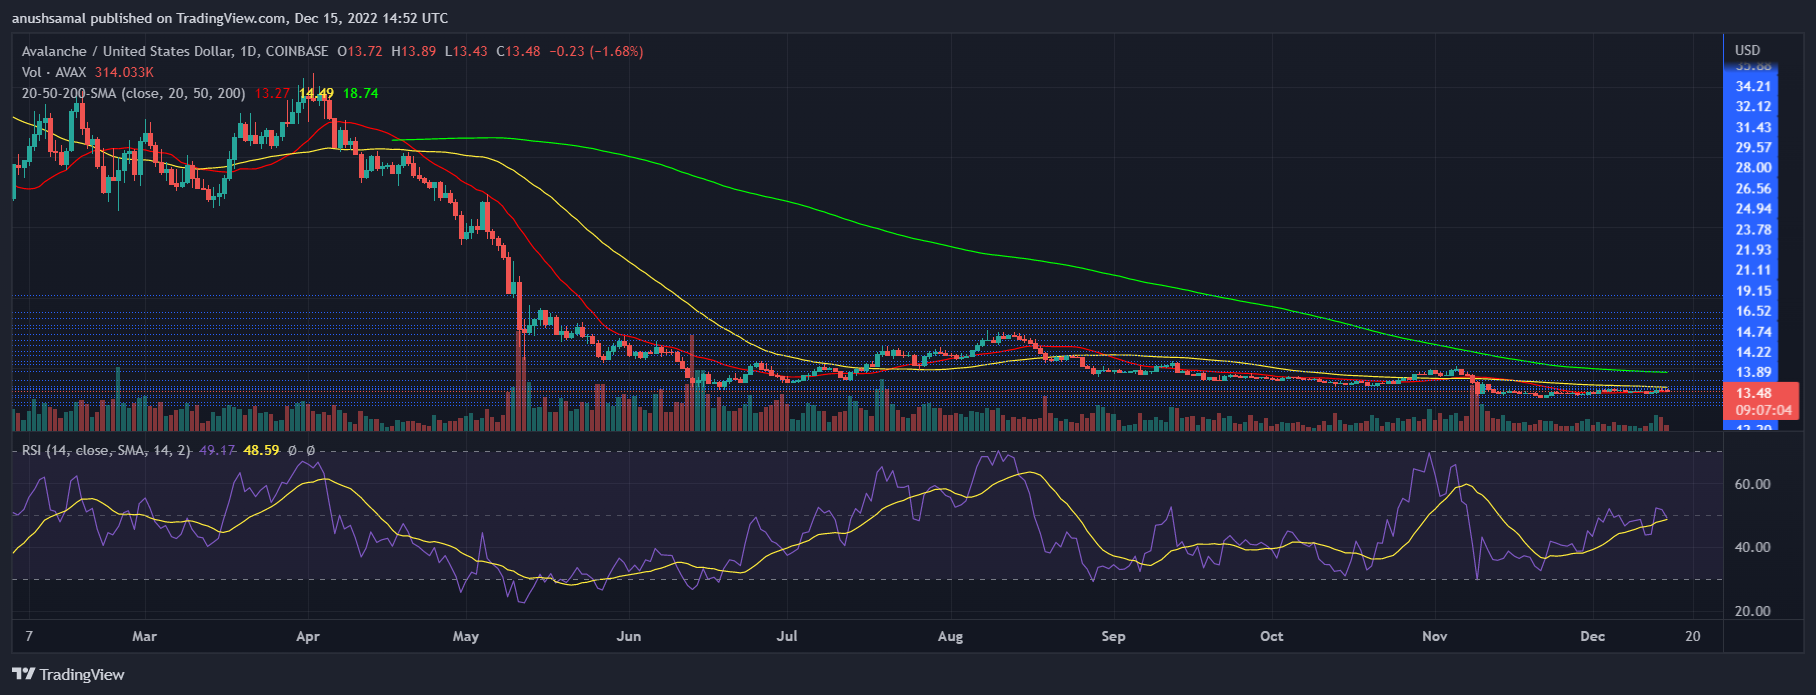
Although the technical outlook pointed to positive price action, demand slightly fell on the daily chart. The Relative Strength Index (RSI) just dipped a little and rested on the half-line. This meant that buying power and selling strength were even.
Other indicators have, however, sided with increased demand. The altcoin was above the 20-day Simple Moving Average as it crossed the $13.40 price mark. This was an indication that the buyers were still driving the price momentum in the market.

Despite the RSI…
Click Here to Read the Full Original Article at NewsBTC…


