Ether (ETH) price has been unable to close above $1,400 for the past 29 days and it has been trading in a relatively tight $150 range. At the moment, the $1,250 support and the $1,400 resistance seem difficult to break, but two months ago, Ether was trading at $2,000. The current price range for Ether simply reflects how volatile cryptocurrencies can be.
From one side, investors are calm as Ether trades 50% above the $880 intraday low on June 18. However, the price is still down 65% year-to-date despite the most exciting upgrade in the network’s 7-year history.
More importantly, Ethereum’s biggest rival, BNB Chain (BNB), suffered a cross-chain security exploit on Oct. 6. The $568 million exploit caused BNB Chain to temporarily suspend all transactions on the network, which holds $5.4 billion in smart contracts deposits.
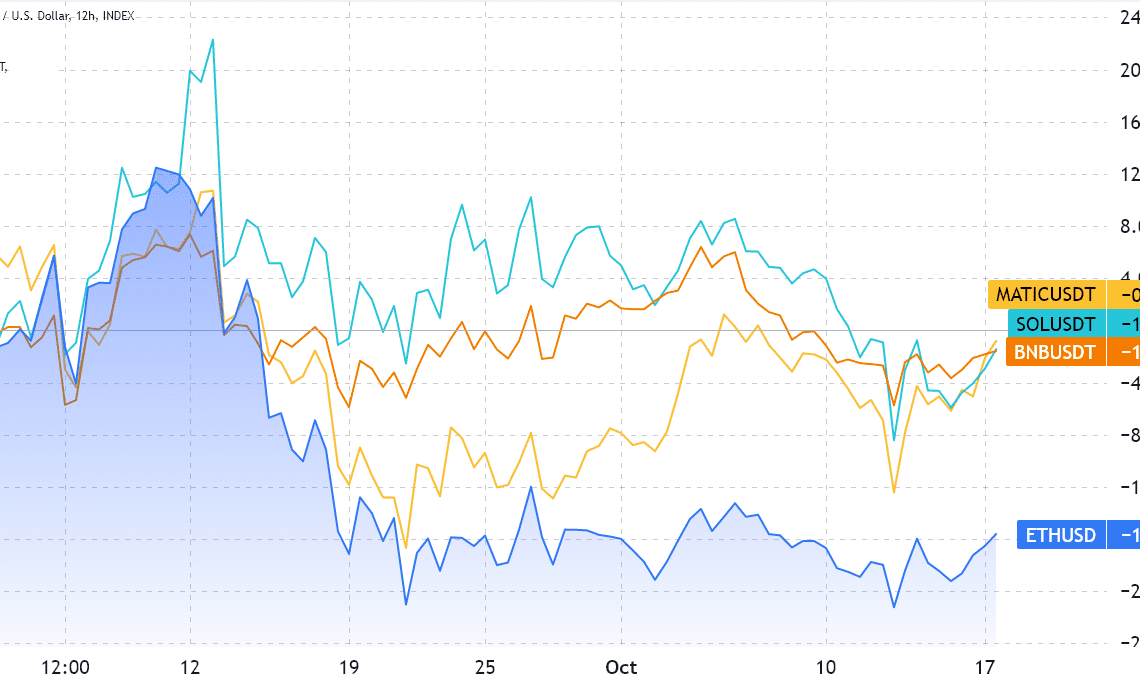
Ether underperformed competing smart contracts like BNB, Cardano (ADA), and Solana (SOL) by 14% since September, even though its TVL in ETH terms increased by 9% during the period. This suggests that the Ethereum network’s issues, such as the $3 average transaction fees, weighed on the ETH price.
Traders should look at Ether’s derivatives markets data to understand how whales and market makers are positioned.
Options traders remain moderately risk-averse
The 25% delta skew is a telling sign whenever professional traders overcharge for upside or downside protection. For example, if traders expected an Ether price crash, the options markets skew indicator would move above 12%. On the other hand, generalized excitement reflects a negative 12% skew.
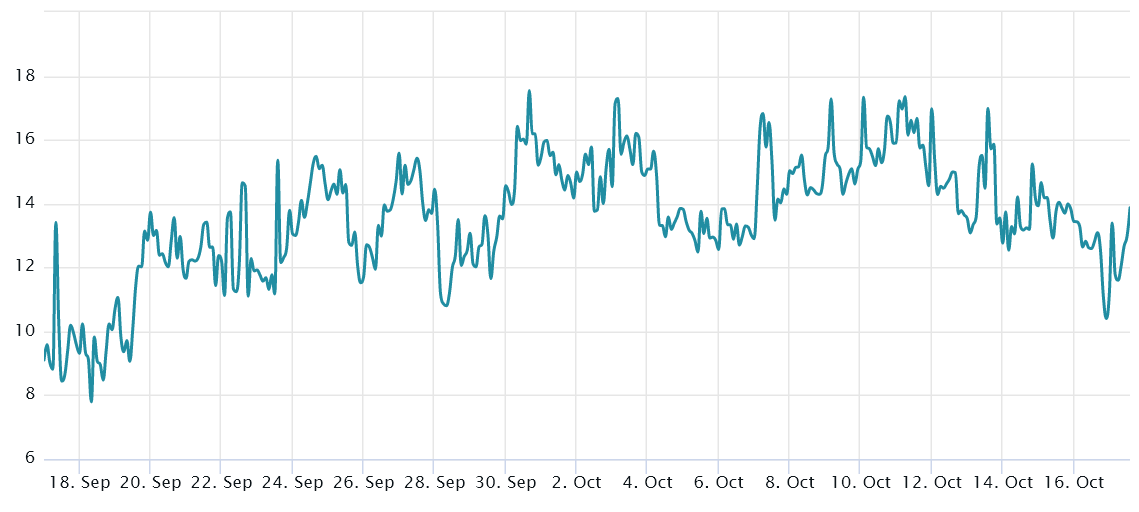
In layperson’s terms, the higher the index, the less inclined traders are to offer downside risk protection. The indicator has been signaling fear since Sept. 19, when it last held a value below 10%. That day marked the temporary bottom of a 28% weekly correction, as the $1,250 support strengthened after such a test.
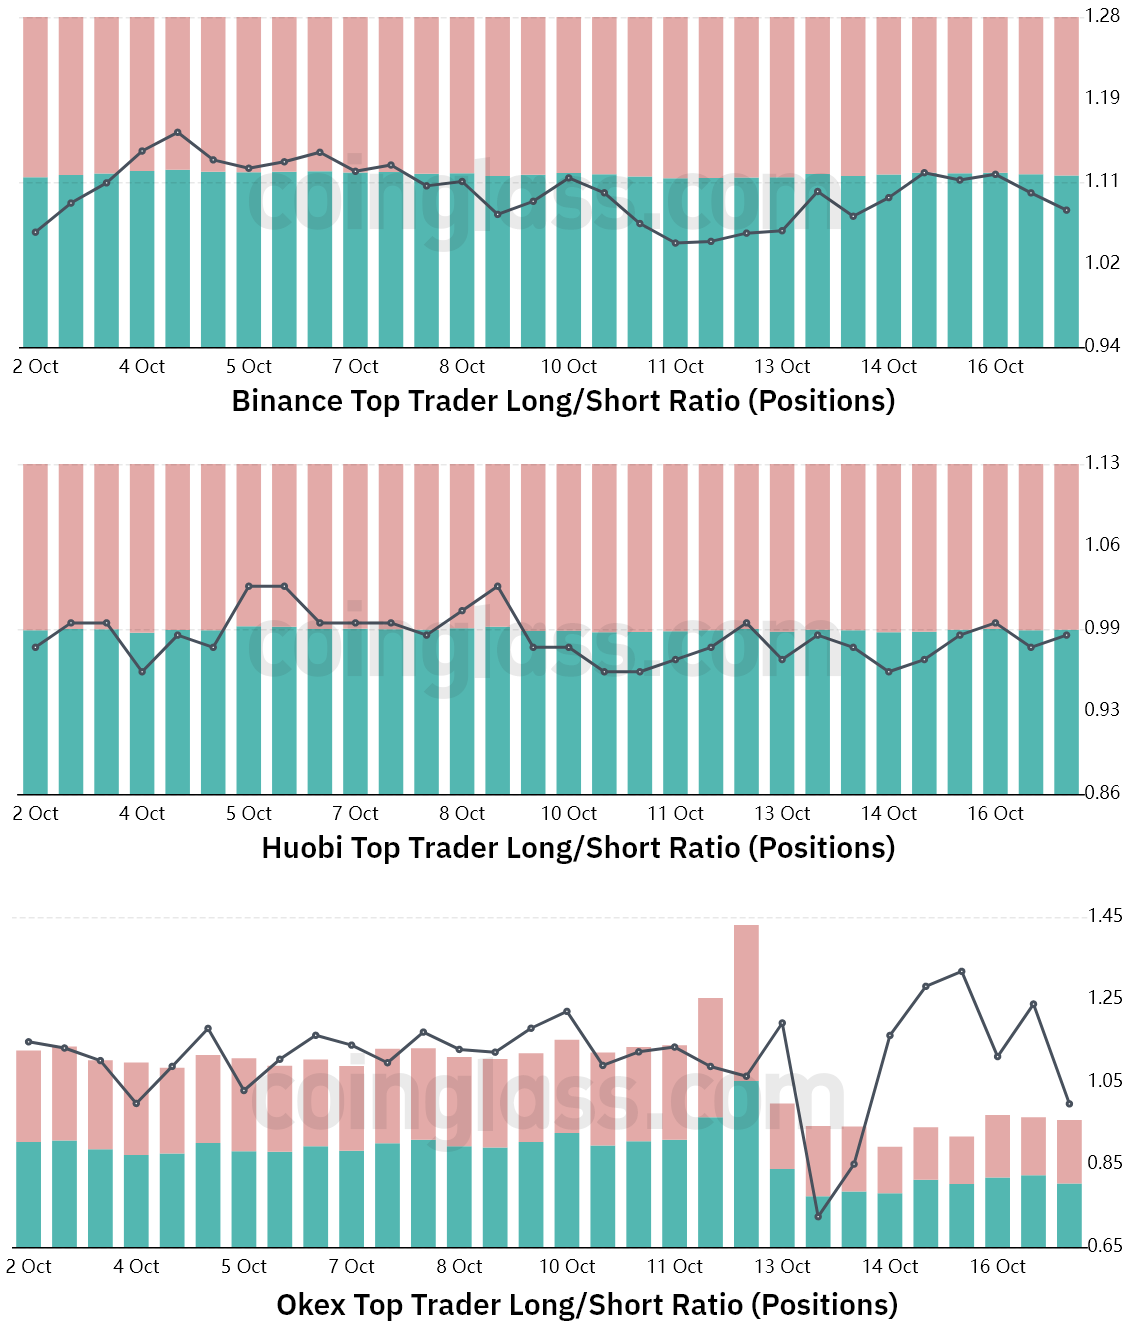
Long-to-short data show traders adding longs
The top traders’ long-to-short net ratio excludes externalities that might have solely impacted the options markets. By aggregating the positions on the spot, perpetual and quarterly futures contracts, one can better understand whether professional traders are leaning bullish or bearish.
There are occasional methodological discrepancies between different exchanges, so viewers should monitor changes instead of absolute figures.
Click Here to Read the Full Original Article at Cointelegraph.com News…


