In this episode of NewsBTC’s daily technical analysis videos, we are going to look at the weekly timeframe on Bitcoin BTCUSD in anticipation of the weekend and weekly close.
Take a look at the video below:
VIDEO: Bitcoin Price Analysis (BTCUSD): September 2, 2022
With the monthly open now out of the way and Friday here, we are looking ahead at the weekend close ahead of what could be an interesting weekend in the crypto market.
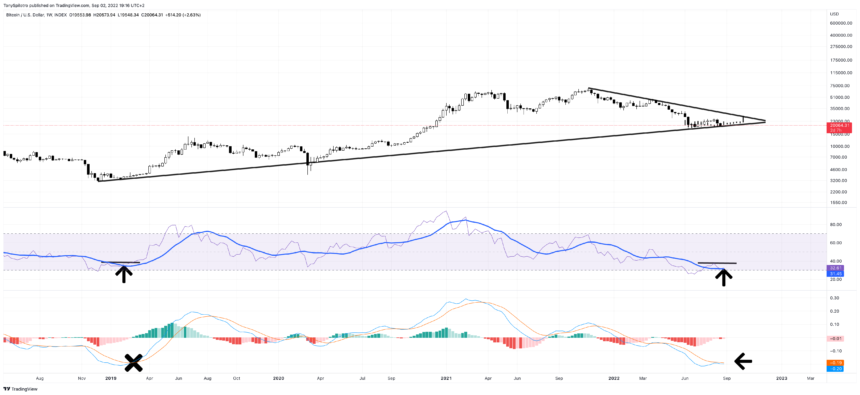
Bitcoin price has been following a fractal from the bear market bottom. Interestingly, the Relative Strength Index has a similar setup as back then well. Meanwhile, momentum is behaving much differently according to the LMACD.
For a buy signal to take place on the Relative Strength Index, the RSI must make a higher high and breach the drawn line in black. The RSI moving average has also held after a retest, much like the last crypto winter.
We are also waiting for a bullish crossover on the weekly LMACD. Momentum has fallen to the same level as the last bear market bottom, but continues to track sideways. Price and both indicators are potentially nearing a breakout of downtrend resistance which could produce a bullish move.
Could the same trend line give us another bottom? | Source: BTCUSD on TradingView.com
Bull’s Hidden Hope For A Reversal
If a bottom forms here, there is potential in an important trend line holding. The trend line doesn’t seem very important until zooming out on monthly timeframes. On the monthly, it is currently supporting the entire trend since 2018 on a candle close basis.
The trend line would give us a potential hidden bullish divergence on both the RSI and LMACD. Given the number of bearish signals from yesterday’s video, this is bull’s best hope for a reversal.
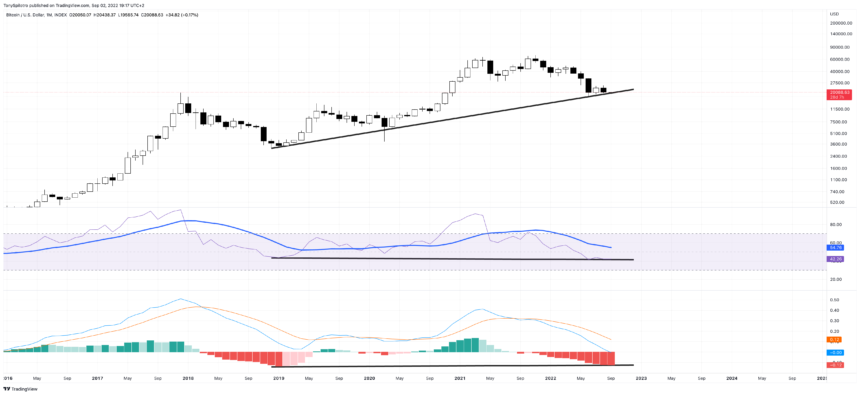
Will this hidden bull div hold firm? | Source: BTCUSD on TradingView.com
Related Reading: WATCH: Waiting On The Bitcoin Monthly: Will Crypto Sink Or Soar? BTCUSD August 31, 2022
Has Powell’s Downtrend Been Broken?
To give us a feel for how the next three days might perform which includes today and our weekend, the below chart represents the 3-day. Taking a moment for education, this is exactly how you would interpret various timeframes. If you want to know how an asset may perform months from now, pay closer attention to the monthly chart.
The 3-day appears ready to diverge upward according to the LMACD. The RSI downtrend resistance continues to narrow, giving the…
Click Here to Read the Full Original Article at NewsBTC…


